6/1/2019
New Map Styles, Map Layers and Vector Maps in Tableau 2019.2
Thank you to Allan Walker for taking the time to review this blog post.
With the release of Tableau 2019.2, there are now new map styles and map layers available in Tableau. This allows the us to create a number of new maps in Tableau without embedding Google maps or other mapping tool like Mapbox. In addition, the mapping layers are now vector maps. In this post I will examine a few of these and explore some of the additional options and formatting that are now available.
First, let's start with vector maps. Prior to version 2019.2, Tableau rendered maps using tiles. When you are connected to the internet, these tiles were downloaded from a server. On a Windows computer, you can see how this works by navigating to C:\Program Files\Tableau\Tableau 2019.1\Mapsources and looking at the Tableau.tms file.

Each Map Style and Layer is also listed in this file.

When you are offline, Tableau uses tiles that are installed locally. You can see these in your local Windows directory in C:\Program Files\Tableau\Tableau 2019.1\Local\Maps\US\normal, which are organized in various tile folders. You will also notice the various zoom levels in the images from folders 1 to 5.
Here is a tile from the highest level zoom.
Here is a tile from the lowest level zoom.
Notice that because these tiles are images that their resolution will depend on the zoom level of the map. This is important, because as the map zooms in, these tiles will pixelate. If you zoom too far on the offline maps which use the local tiles, you will actually get an error in Tableau Maps.

When you are connected to the Internet the tiles will zoom in much further but eventually they will pixelate as well. With Tableau 2019.2 and vector maps, we can zoom in to the lowest level of streets and get a beautifully detailed map without pixelation (because it's a vector image instead of a tiled image).
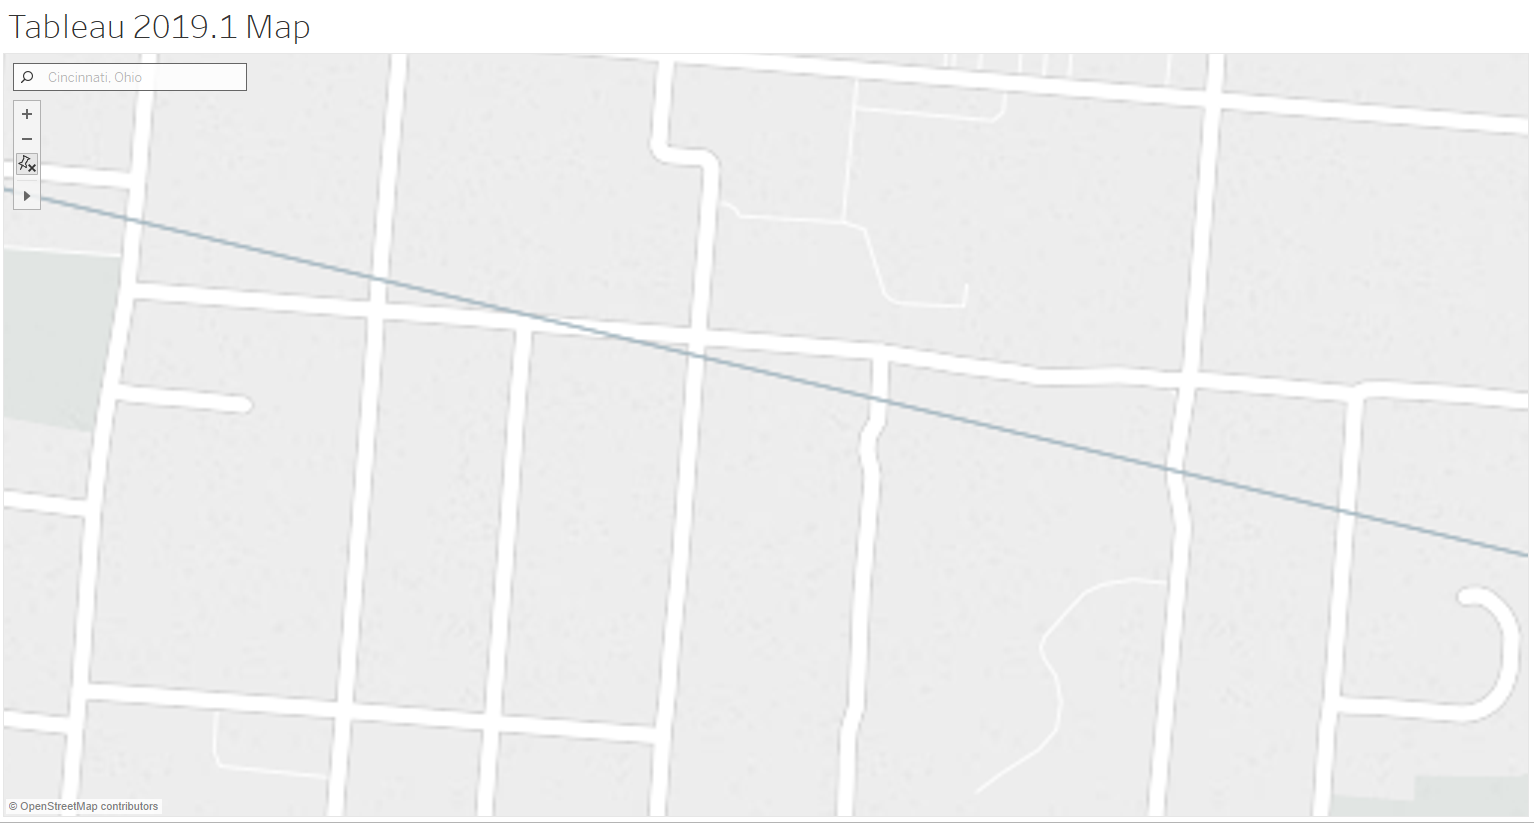
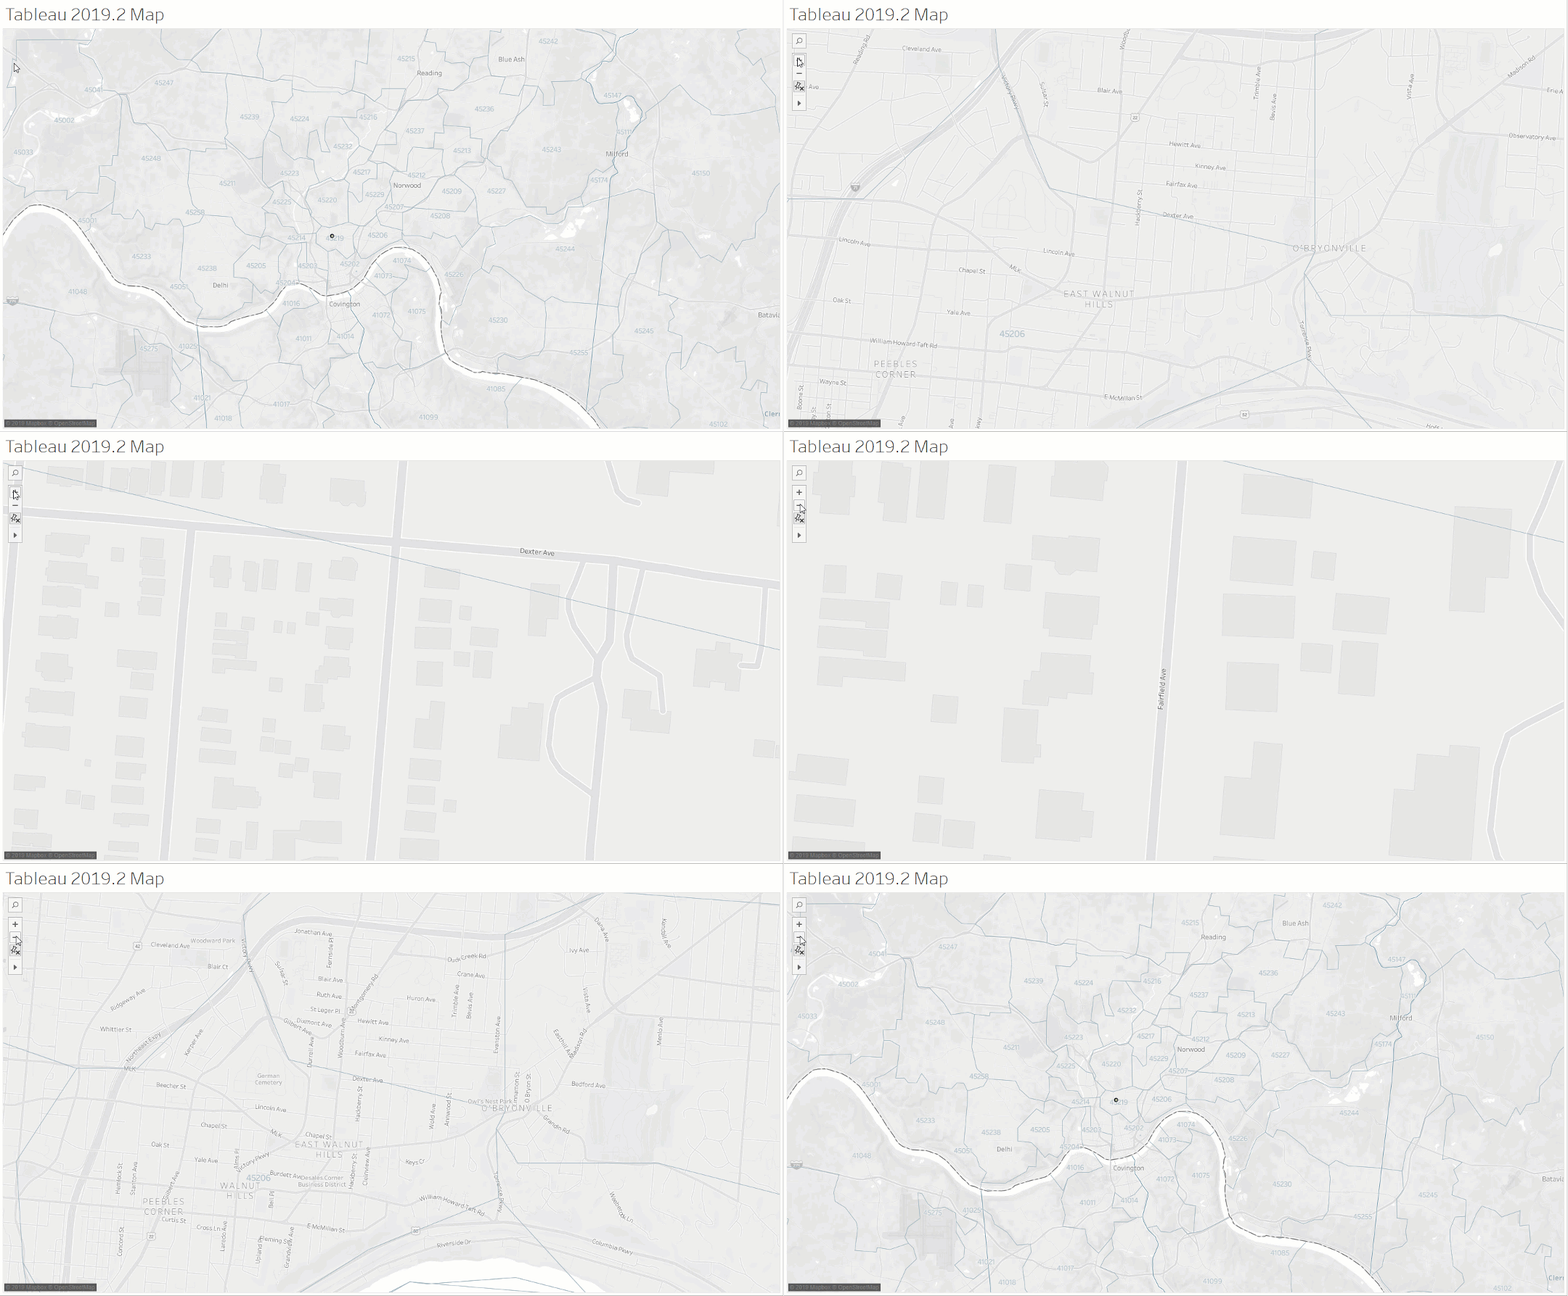
Here is a Map from Tableau 2019.1 (tiled). Notice the streets are blurry and even though Streets and Highways are checked as a layer, the names of the streets do not show up after a certain zoom point.
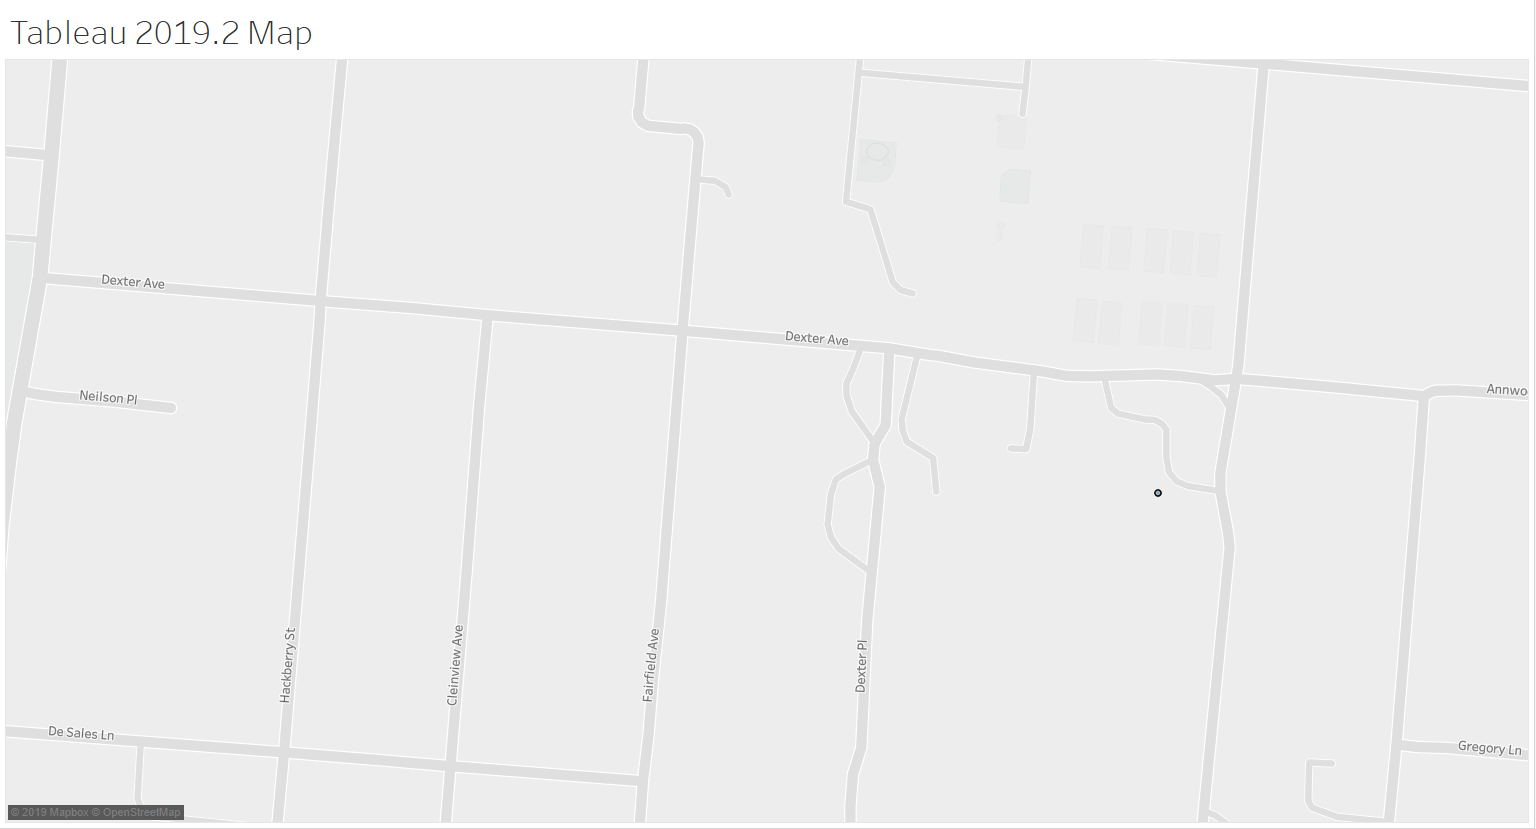
Here is a Map from Tableau 2019.2 (vector). Notice the map renders perfectly at every zoom level and the names of the streets show up even at detailed zoom.
In addition to the quality of the image, zooming in on the tiled maps can also be clunky and it "steps" from tile to tile.

The vector maps in Tableau 2019.2 are quick and seamless when zooming in and out or panning from view to view.
These beautiful vector maps are now rendered through Mapbox. Here is the connection through the new TMS file.

New Map Styles and Map Layers
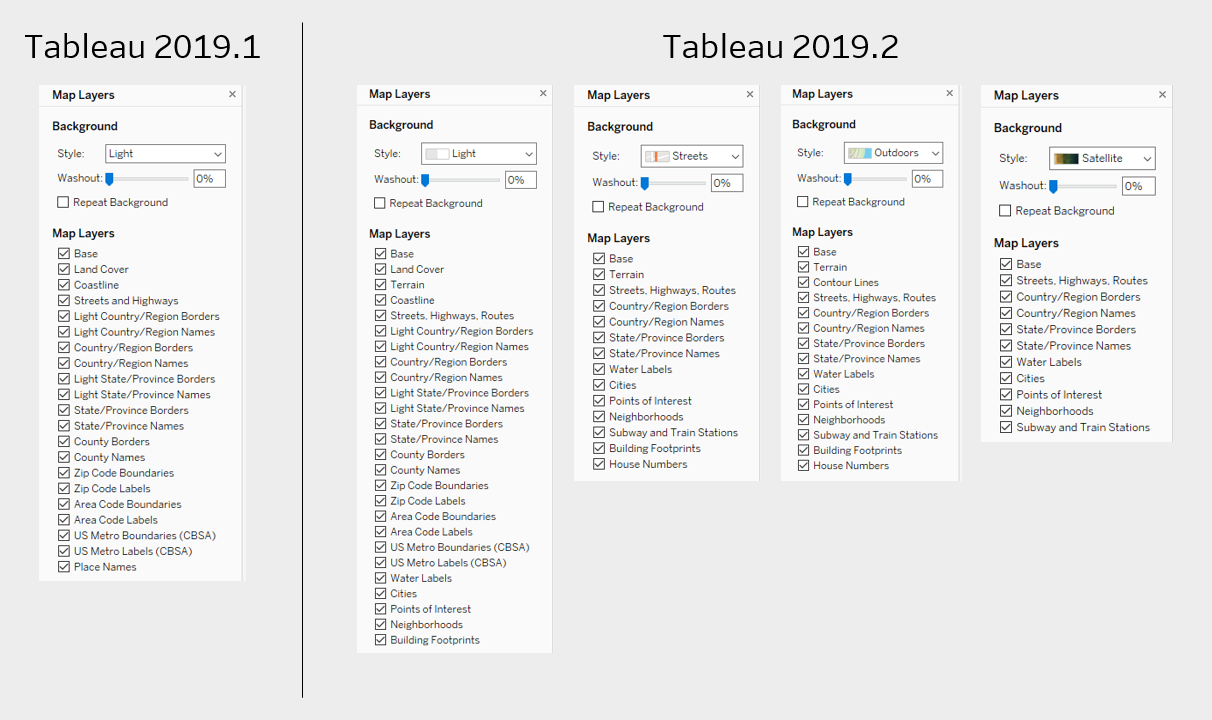
Next, you will notice that the Light, Normal and Dark styles are still available. However, these three have been updated with more Map Layers and there are now three more Map Styles, Streets, Outdoors and Satelite, also with additional layers. Notice the additions of Water Labels, Cities, Points of Interest, Neighbohoods, Building Footprints, House Numbers, and Subway and Train Stations.
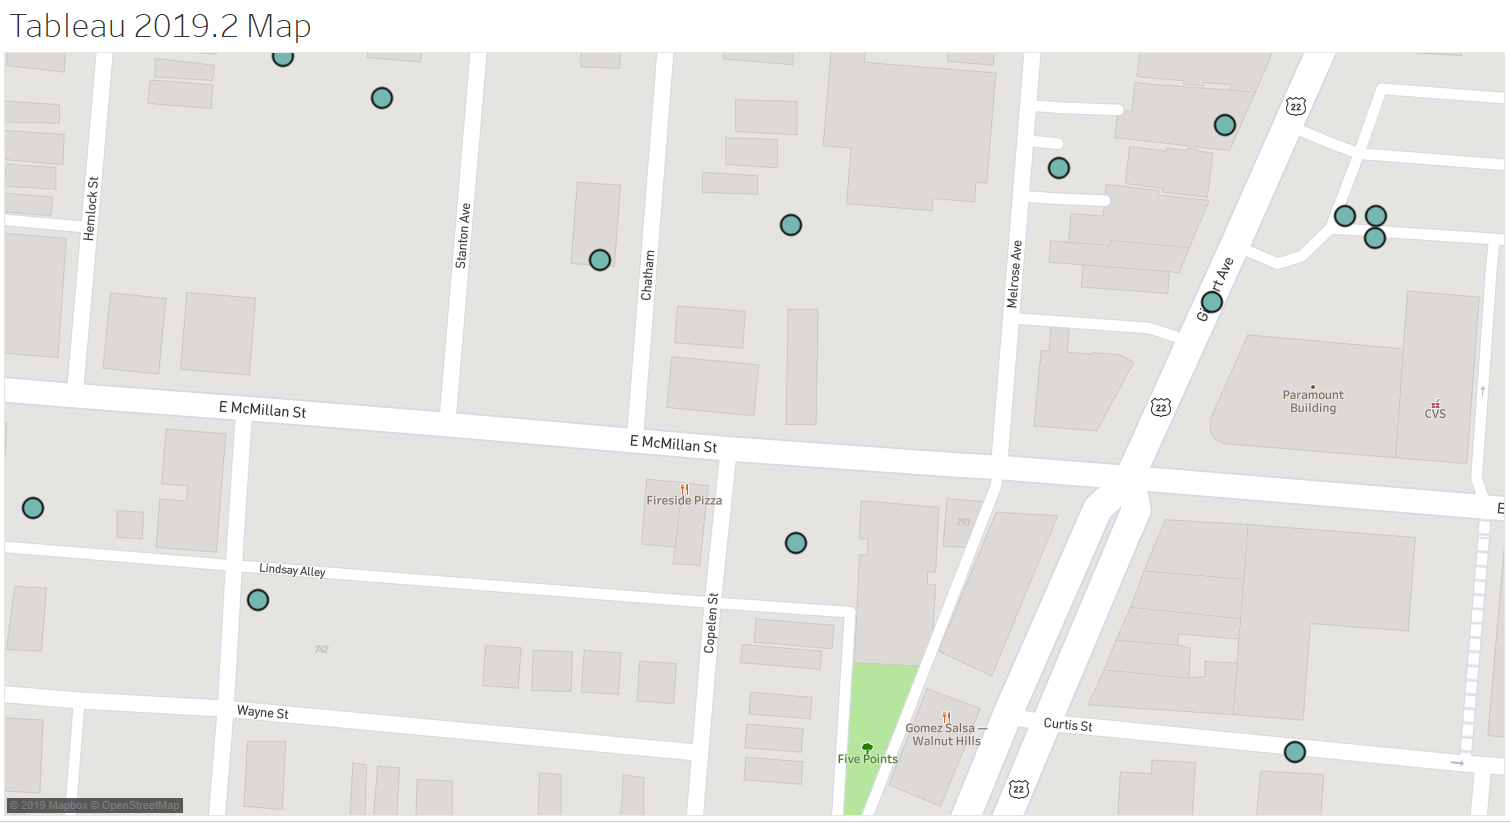
These new map layers bring a new dimension of mapping to Tableau. Check out the details of the Streets map layer with Building Footprints, House Number and Point of Interest. and we can easily plot our data on top of it. Here are the traffic accidents in Cincinnati around Fireside Pizza, a Point of Interest that now automatically shows up on the map layer (and a big thank you to Fireside for hosting our last Cincinnati TUG meeting).
And here is a Satelite view of that same data with a simple click of a button. This is much easier to implement vs. an embedded Google map through a web object, which has specific URL requirements and can be problematic because it requires an iframe (see my post on Embedding Google Maps in Tableau for more information about this process).

Formatting the New Map Layers
If we apply the map formatting options described in my blogs posts Creating "Beautiful Minimalistic Maps" in Tableau without Mapbox and More Custom Map Tips for Tableau without Using Mapbox then we can create all sorts of mapping magic. Note - the vector maps are now supplied through Mapbox, so the titles of my previous posts are not technically correct anymore. They should probably read without "custom Mapbox maps".
As outlined in these blog posts, removing the Base layer and applying Shading at the Pane with allow us to color our maps in all sorts of ways. Try toggling between the various map layers and the different colors of the Pane.
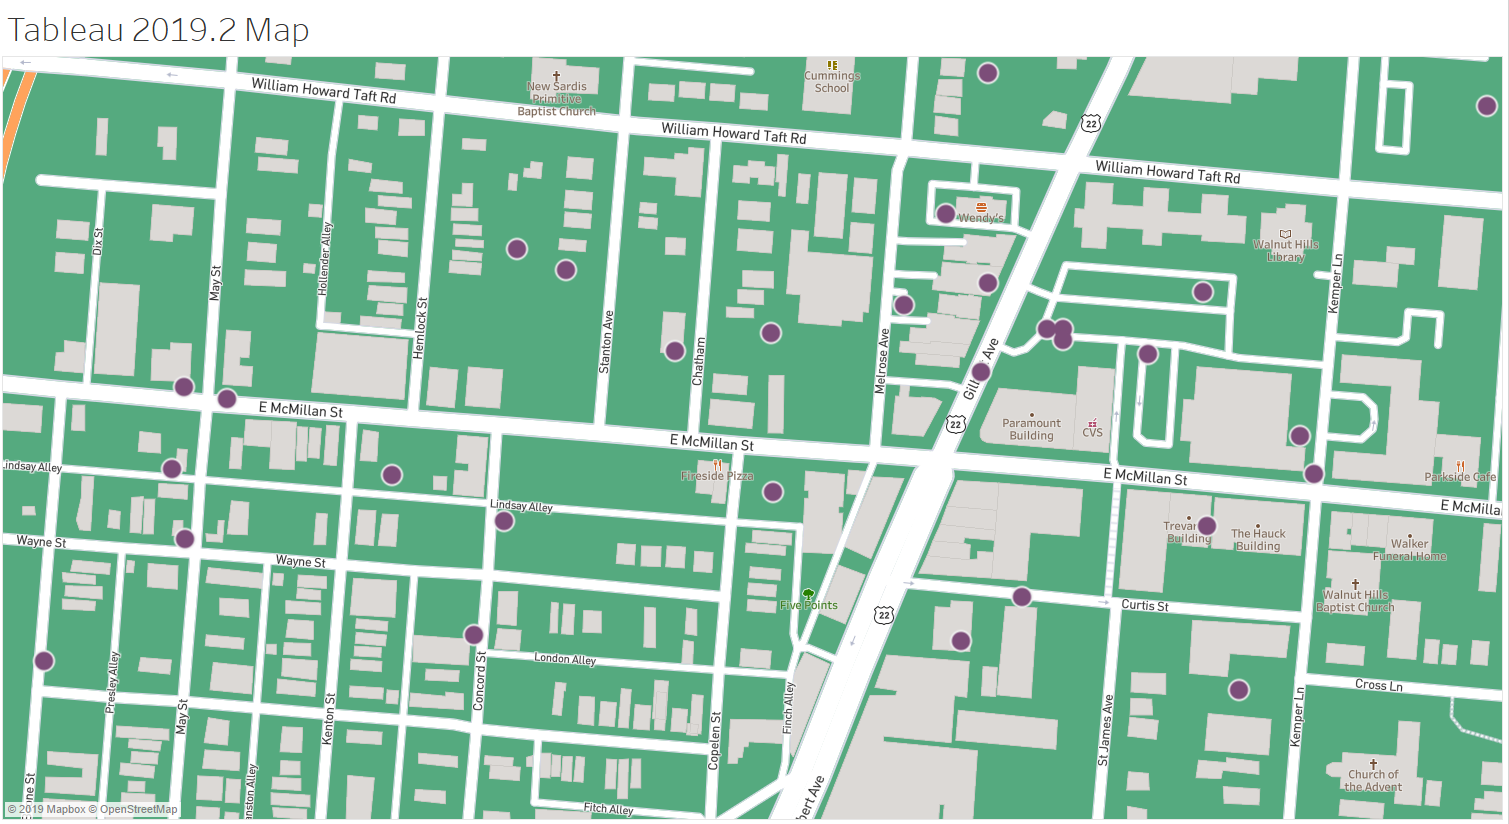
Below is a visualization using these techniques. Both of these maps are built entirely in Tableau with the new built-in map styles and map layers.


