1/1/2015
Node-Link Tree Diagram in Tableau
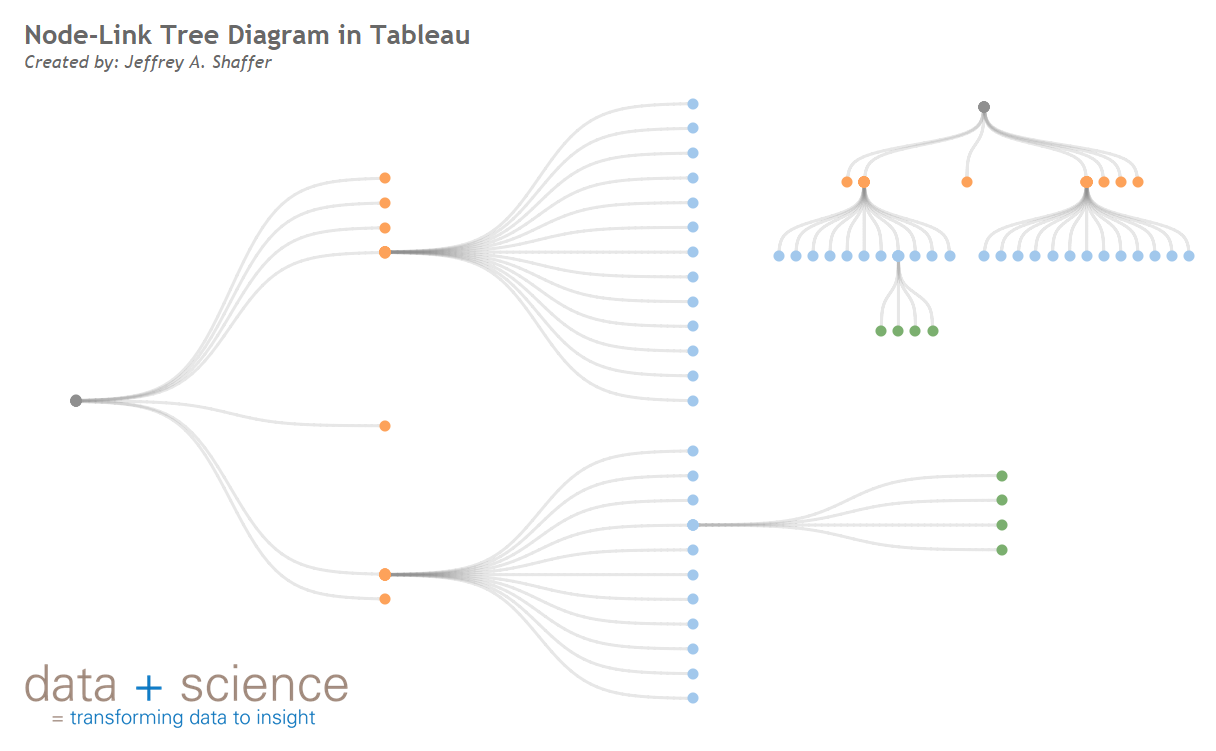
Back in November someone from Zurich, Switzerland, emailed me about using my sankey-style slopegraph technique in Tableau to emulate a chart in D3. The diagram is often referred to as a node-link tree diagram. To build this I utilized the same technique as outlined here. I posted an image on Twitter back in November here but the data used to build this was proprietary so I wasn't able to post the workbook. I anonymized the data and the Tableau workbook is now posted here

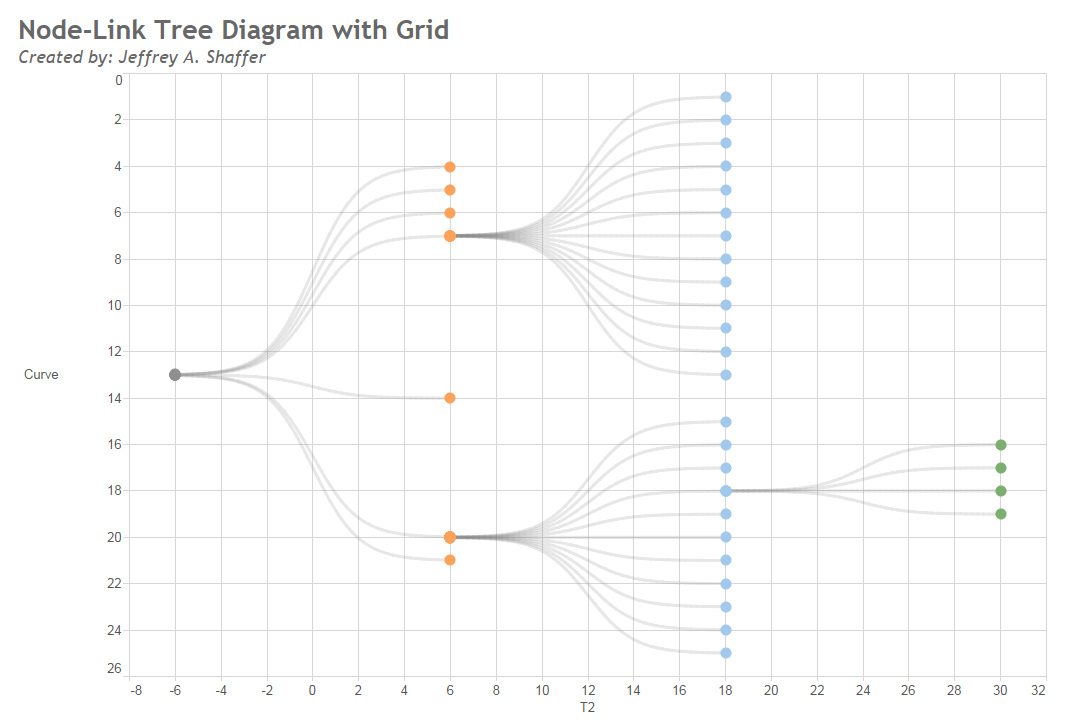
The primary difference in this approach vs. the original sankey-style slopegraph (here and here) is that there are multiple levels. In the original design the field T goes from -6 to 6 in increments on .25. In this workbork there is a new field T2 which is equal to T + 12 for level 2 and T + 24 for level 3.
Root Node to Level 1: T = -6 to 6
Level 1 to Level 2: T = 6 to 18
Level 2 to Level 3: T = 18 to 30
An alternative approach: Create a field for each level and then set T2 = T +12 or +24 based on the level.
Below is an image of the same visualization with the axis labels and gridlines to show how this approach works.

The created a dual axis to create the circles on the nodes, changing the second Marks to Circles instead of Lines. I created a calculated field for Color (optional) so that each node level would be a different color:
Calculated Field Name: Color
Formula:
if sum([T2])= -6 then 'gray'
elseif sum([T2])= 6 then 'orange'
elseif sum([T2])= 18 then 'blue'
elseif sum([T2])= 30 then 'green'
end
Once the first chart is complete simply swap the rows and columns and reverse the scale on the Y-Axis (T2) to have the chart go down instead of across.

