6/24/2020
How to Create a Map Zoom with Buffer Calculation in Tableau
Last year I wrote a blog post Map Zoom with Radial Distance and Increasing Mark Size in Tableau. This technique is used to create a custom map zoom, by plotting a circle around a given point at a custom distance. This blog post will outline a very similar technique, however, we will use the new Buffer function in Tableau 2020.1 in a calculation rather than plotting a circle using 360 points.
For this blog post I am going to use this Excel spreadsheet of Airports in the Continental United States.
I'll start with a simple map plotting the airports.
Load the Airport ORIG dataset into Tableau.
Double-click Latitude Degrees to add it to Rows.
Double-click Longitude Degrees to add it to Columns.
Drag ID to the Details on the Marks Card
Let's add a Worksheet Filter to demonstrate how the default map zoom works.
Select Worksheets from the top menu.
Select Actions.
Select Add Action and select Filter.
Set the Run Action on Select.
Set the Clearing the selection will to Show all values and click OK twice.
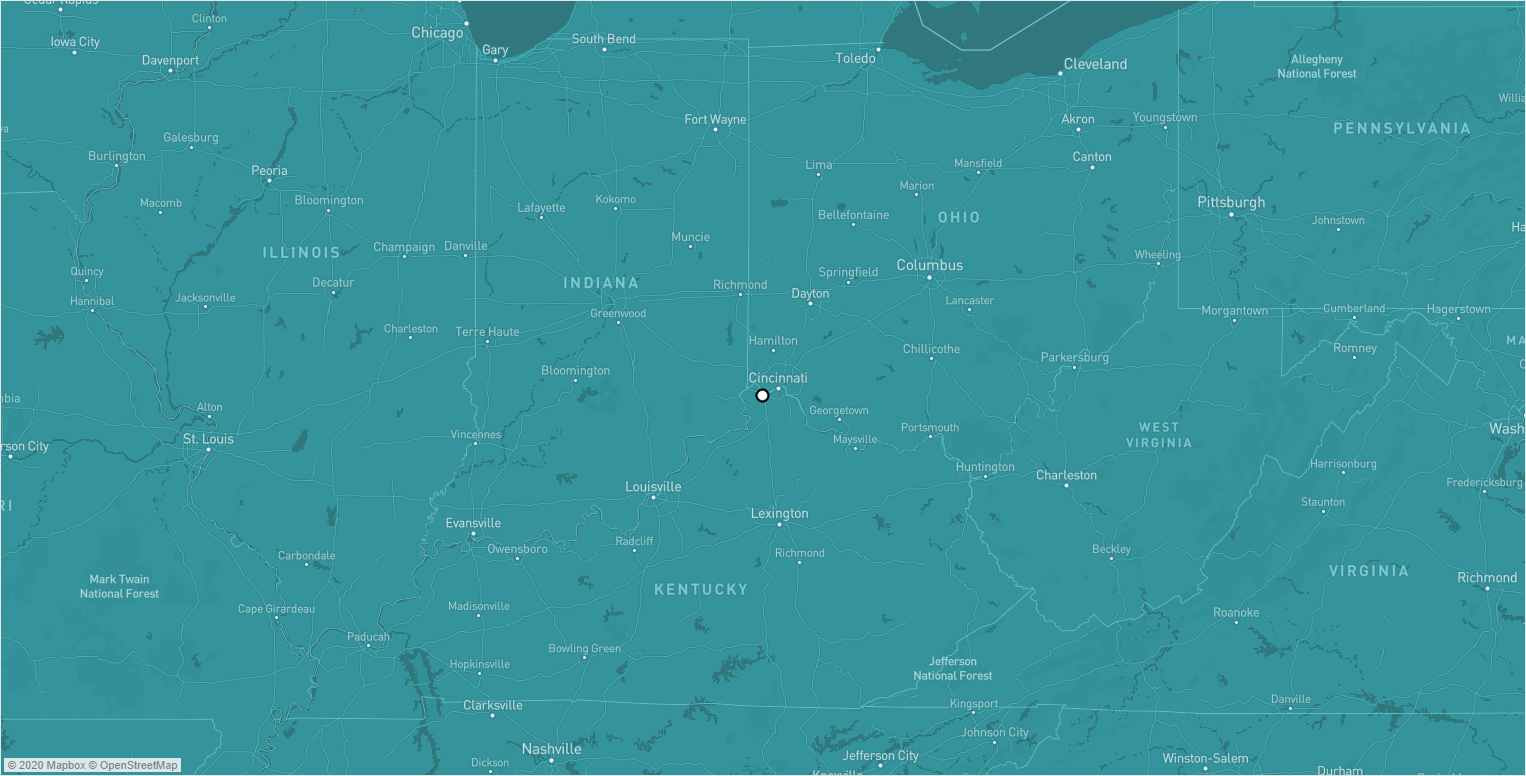
When you click on a single airport, you will notice that a single dot is shown, but the zoom level is automatically set to the region level showing a number of states in the view. If there are two points in the view the map will automatically zoom in to fit the two points in the window, but with a single point, this zoomed out regional view is the default. This can be a frustrating view and there is no zoom control for setting the zoom level automatically.

Using a Buffer Calculation for Custom Map Zoom
We can solve this regional level zoom by creating our own custom zoom level. Rather than plotting 360 points around a single map point, we will utilize the new Buffer function. Let's build the same map using the new Buffer function in a calculation along with a parameter that will allow the user to control the map zoom. Start by creating new worksheet.
First, we will need a new parameter:
Parameter: Zoom
Data Type: Integer
Allowable Values: List
Enter the values of 1,3, 5, 10, 25, 50, 100, 250 and 500
Current Value: 10
Right-click on Zoom and select Show Parameter.
Calculated Field: Buffer Zone
Formula: Buffer(Makepoint([Latitude Degrees], [Longitude Degrees]), [Zoom], 'miles')
Note - this is a new function in Tableau 2020.1.
The syntax is BUFFER(geometry, number, 'units')
Geometry - this is a Spatial Point or set of points. When using latitude and longitude points simply use a MAKEPOINT function. Ex. Makepoint([Latitude Degrees], [Longitude Degrees])
Number - is the distance of the buffer measured as the radius of the circle around the Spatial Point.
Units - the unit of measure for distance. Ex. 'miles', 'meters', 'ft', 'km')
Double-click Buffer Zone to add Longitude (generated) to Columns, Latitude (generated) to Rows and Buffer Zone to Details on the Marks card.
Drag ID to the Details on the Marks Card
Duplicate Latitude (generated) on Rows by dragging Latitude (generated) to Rows again and placing next to Latitude (generated) or using the CTRL key and dragging Latitude (generated) next to itself on the Rows.
Select the bottom Marks Card:
Remove COLLECT(Buffer Zone) from the Details on the Marks Card
Drag Latitude (generated) to the Details on the Marks Card
Drag Longitude (generated) to the Details on the Marks Card
Right-click on the second Latitude (generated) and select Dual Axis
Select the middle Marks Card (the one with COLLECT(Buffer Zone):
Select Color on the Marks card and set the Opacity to 0% and Border to None
Let's add a Worksheet Filter to demonstrate how the default map zoom works.
Select Worksheets from the top menu.
Select Actions.
Select Add Action and select Filter.
Uncheck the first worksheet you created (Sheet 1) and check the new worksheet (Sheet 2).
Set the Run Action on Select.
Set the Clearing the selection will to Show all values and click OK twice.
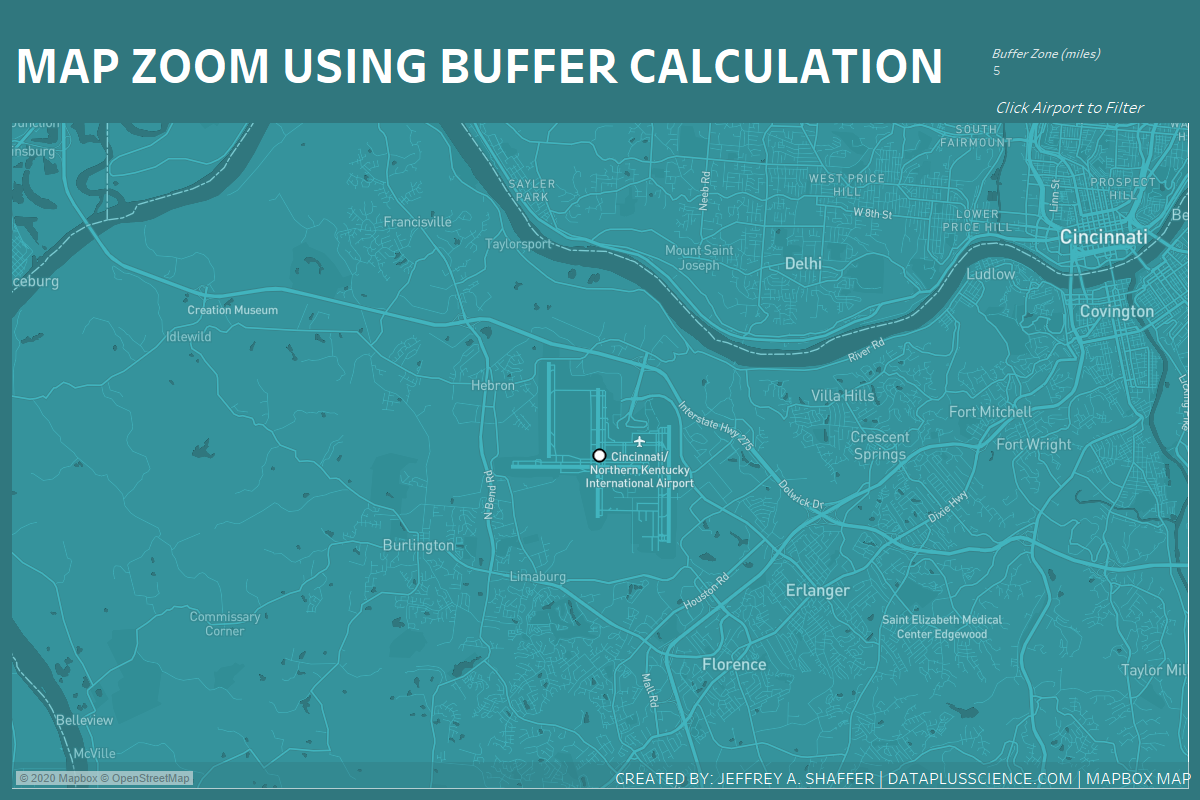
Now when you click on a single airport, the map will zoom in much more than the region level. As you change the parameter Zoom, the map will zoom in to different levels.

Below is a Tableau Public Visualization that you can download and explore. Click on a point to filter and adjust the Buffer Zone to control the zoom level of the map.

