8/26/2019
Map Marker Clustering in Tableau Using Parameter Actions
Last month I posted on how to create a map zoom with a radial distance circle and increasing mark size. In this blog post, I will demonstrate how to do marker clustering in Tableau using parameter actions. When plotting hundreds or thousands of points on a map, the map can get very cluttered. One technique that can be useful is clustering the points into one marker. The size of the marker can indicate the number of points in that area.

This technique requires a few calculations and a parameter action, but it is pretty straight forward. I will use the same dataset that I used in my previous post, without the extra fields. You can download the dataset here to follow along. This dataset has some three fields for some points in Cincinnati, Ohio. We will map these points using Latitude and Longitude in the dataset.
Load the CSV file into Tableau.
Drag Incident No from Measures to Dimensions.
Calculated Field: Latitude Dimension
Formula:
[Latitude]
Drag Latitude Dimension from Measures to Dimensions.
Double-click Longitude to add it to Columns.
Drag Incident No to the Details on the Marks Card
Parameter: Zoom Rotate
Data Type: Integer
Current Value: 1
Allowable Values: List
Enter the values of 1, 2, 3
Current Value: 1 [default]
NOTE - you will need a value for each level of zoom that you want on the mark clusters. In this example, Level 1 will be a single map marker of all points, level 2 will be a grouping of marks and level 3 will show all marks individually.
Right-click on the parameter and select Show Parameter
Double-click Latitude to add it to Rows.
Double-click Longitude to add it to Columns.
Drag Latitude Dimension to Details on the Marks Card.
NOTE - we could use Incident No or any other unique dimension in the dataset to create groups, but I will make a dimension out of the Latitude to show that we can do this with just a Latitude and a Longitude.
For this dataset, we are going to create a custom grouping for the points. In practice, this could be cities, neighborhoods, zip codes, blocks, or whatever geographics area you would like.
Using the Radial Selection tool on the map, select the west side of Cincinnati and select a group of points.
Once they are selected, right-click and click the paperclip to add them to a group.
Repeat these steps for the east side of Cincinnati, the points in the north and any other grouping you would like. When you are done, these will be the groups of points that will cluster into a mark.
Next we need to create a bunch of calculated fields that will toggle based on the parameter.
The first set of calculations will create a New Latitude and New Longitude. When level 3 is selected on the Zoom Rotate parameter then the calulated field will use the Latitude and Longitude of the points. When it's not selected it will average them together into a marker.
Calculated Field: New Latitude
Formula:
if [Zoom Rotate] = 3
then [Latitude]
else { fixed [Latitude Dimension (group)] : avg([Latitude])}
end
Calculated Field: New Longitude
Formula:
if [Zoom Rotate] = 3
then [Longitude]
else { fixed [Latitude Dimension (group)] : avg([Longitude])}
end
Right-click on New Latitude and select Geographic Role and select Latitude.
Right-click on New Longitude and select Geographic Role and select Longitude.
The Rotation Index is used to rotate the views in the parameter action. It's sets the next level for whatever level is selected. If the parameter is set to 1 or 2, then the index will add one. When it's set to 3 then it will be 1 so that we start back at the beginning with one marker.
Calculated Field: Rotation Index
Formula:
if [Zoom Rotate] = 3
then 1
else [Zoom Rotate] + 1
end
The next set of calculations are used to burst the dots on the map to the right level of granularity. On the First Zoom, if the parameter is set to 1 then it is NULL so that the points aggregate into a single marker, otherwise it uses the groups that are defined. On the Second Zoom it splits the dots by the Latitude Dimension when the parameter is set to 3.
Calculated Field: First Zoom
Formula:
if [Zoom Rotate] = 1
then NULL
else [Latitude Dimension (group)]
END
Calculated Field: Second Zoom
Formula:
if [Zoom Rotate] = 3
then [Latitude Dimension]
END
The Label, Size and Tooltip calculation are used so that they are dynamically changed when the different parameter values are selected.
Calculated Field: Label
Formula:
if [Zoom Rotate] !=3
then {fixed [Latitude Dimension (group)] : sum([Number of Records]) }
end
Calculated Field: Size
Formula:
if [Zoom Rotate] !=3
then {fixed [Latitude Dimension (group)] : sum([Number of Records]) }
else 1
end
Calculated Field: Tooltip
Formula:
if [Zoom Rotate] = 3
then 'INCIDENT #: ' + str([Incident No])
elseif [Zoom Rotate] = 2
then str([Label]) + ' TOTAL INCIDENTS'
END
At this point, it's easier to start over on a new Worksheet to create a the visualization. Click the Clear Sheet button on the toolbar or create a new Worksheet.
Double-click New Latitude to add it to Rows.
Double-click New Longitude to add it to Columns.
Double-click Size to add it to Size.
Double-click on the Size legend to edit the Size
Set the Sizes Vary to By Range
Select Start Value for Range and set to 0
Select End Value for Range and set it 1000 (or desired value)
Drag the Slider out on the Largest end to make the Size bigger for the large markers and the smaller end to adjust the smaller markers.
Drag Label to Label on the Marks Card.
Select Label in the Marks Card and set Alignment to Vertical Middle
Drag Tooltip to Tooltip on the Marks Card.
Drag First Zoom to Details on the Marks Card.
Drag Second Zoom to Details on the Marks Card.
Drag Rotation Index to Details on the Marks Card.
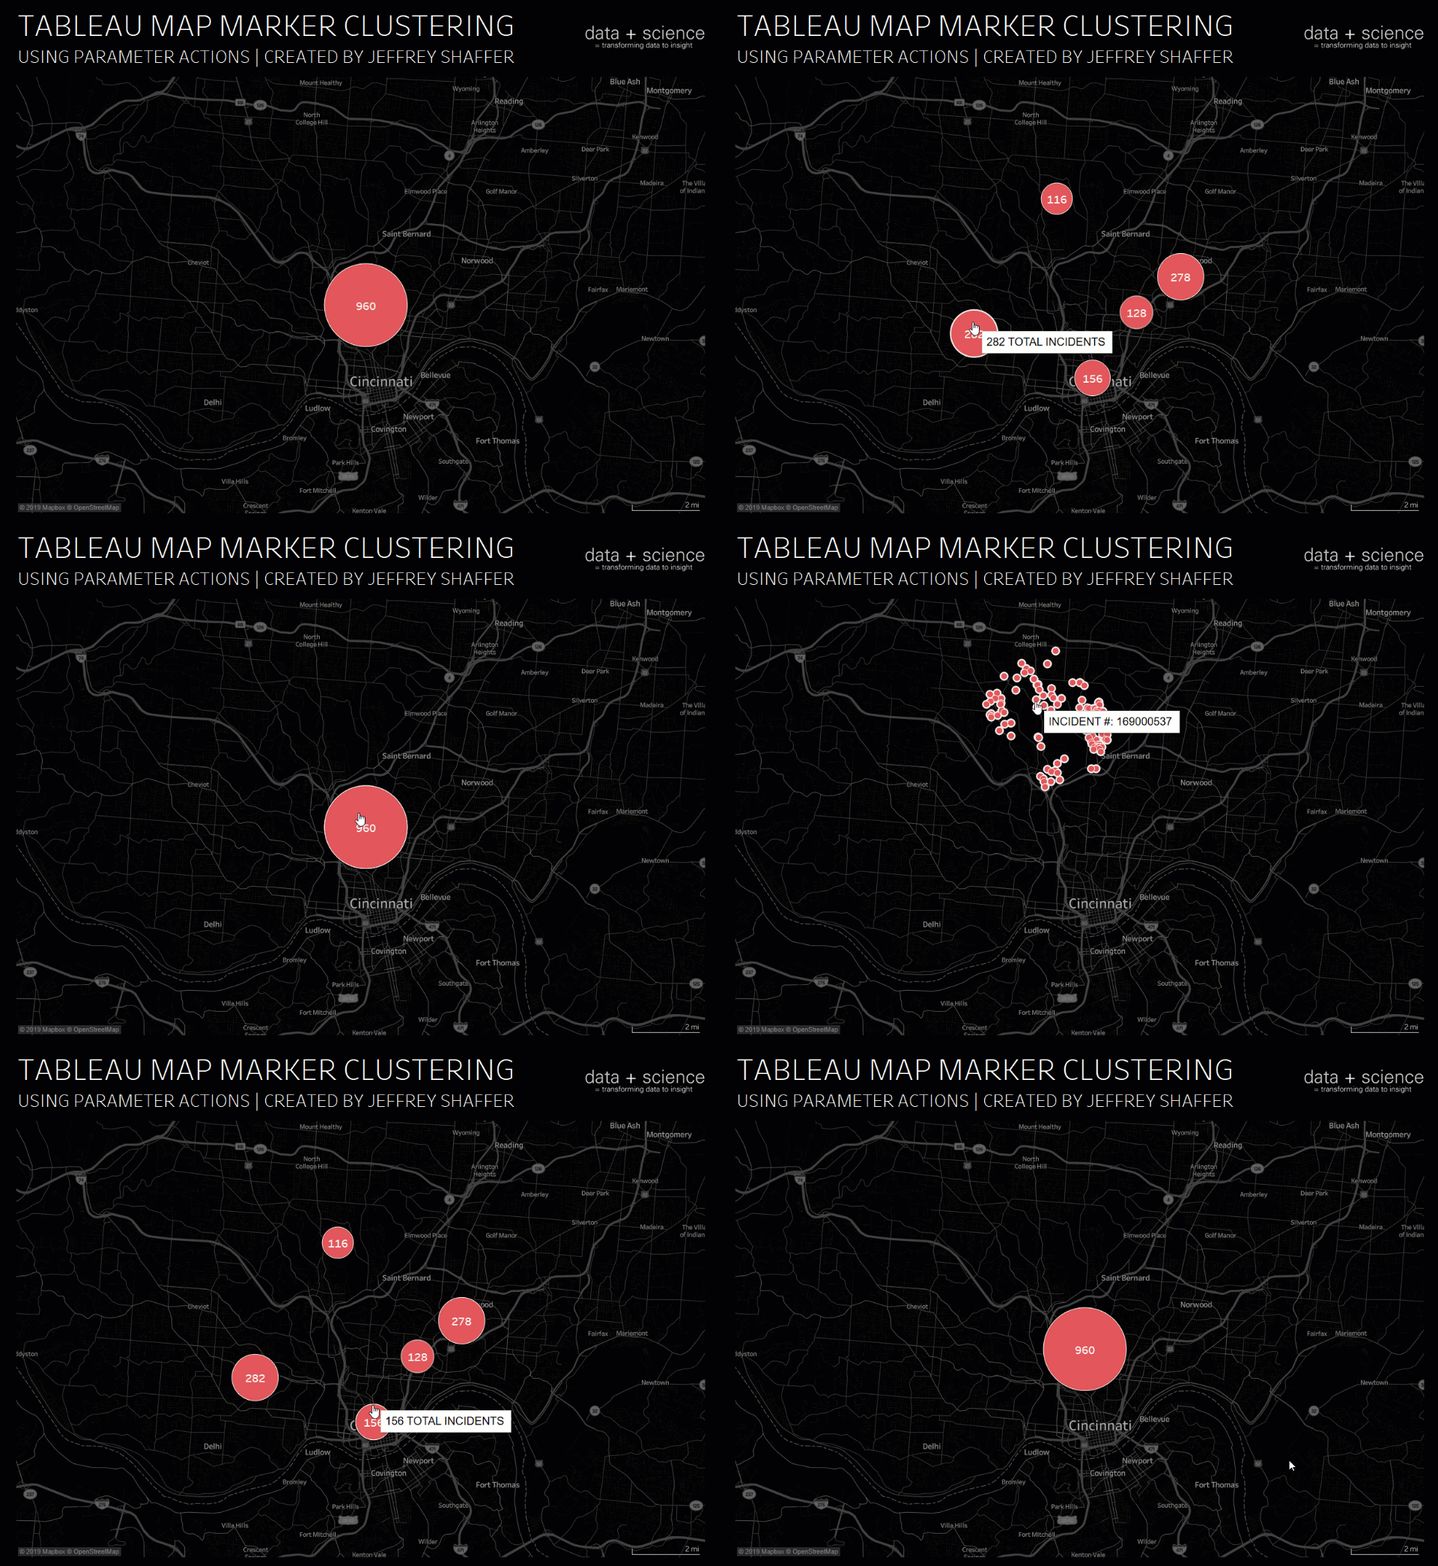
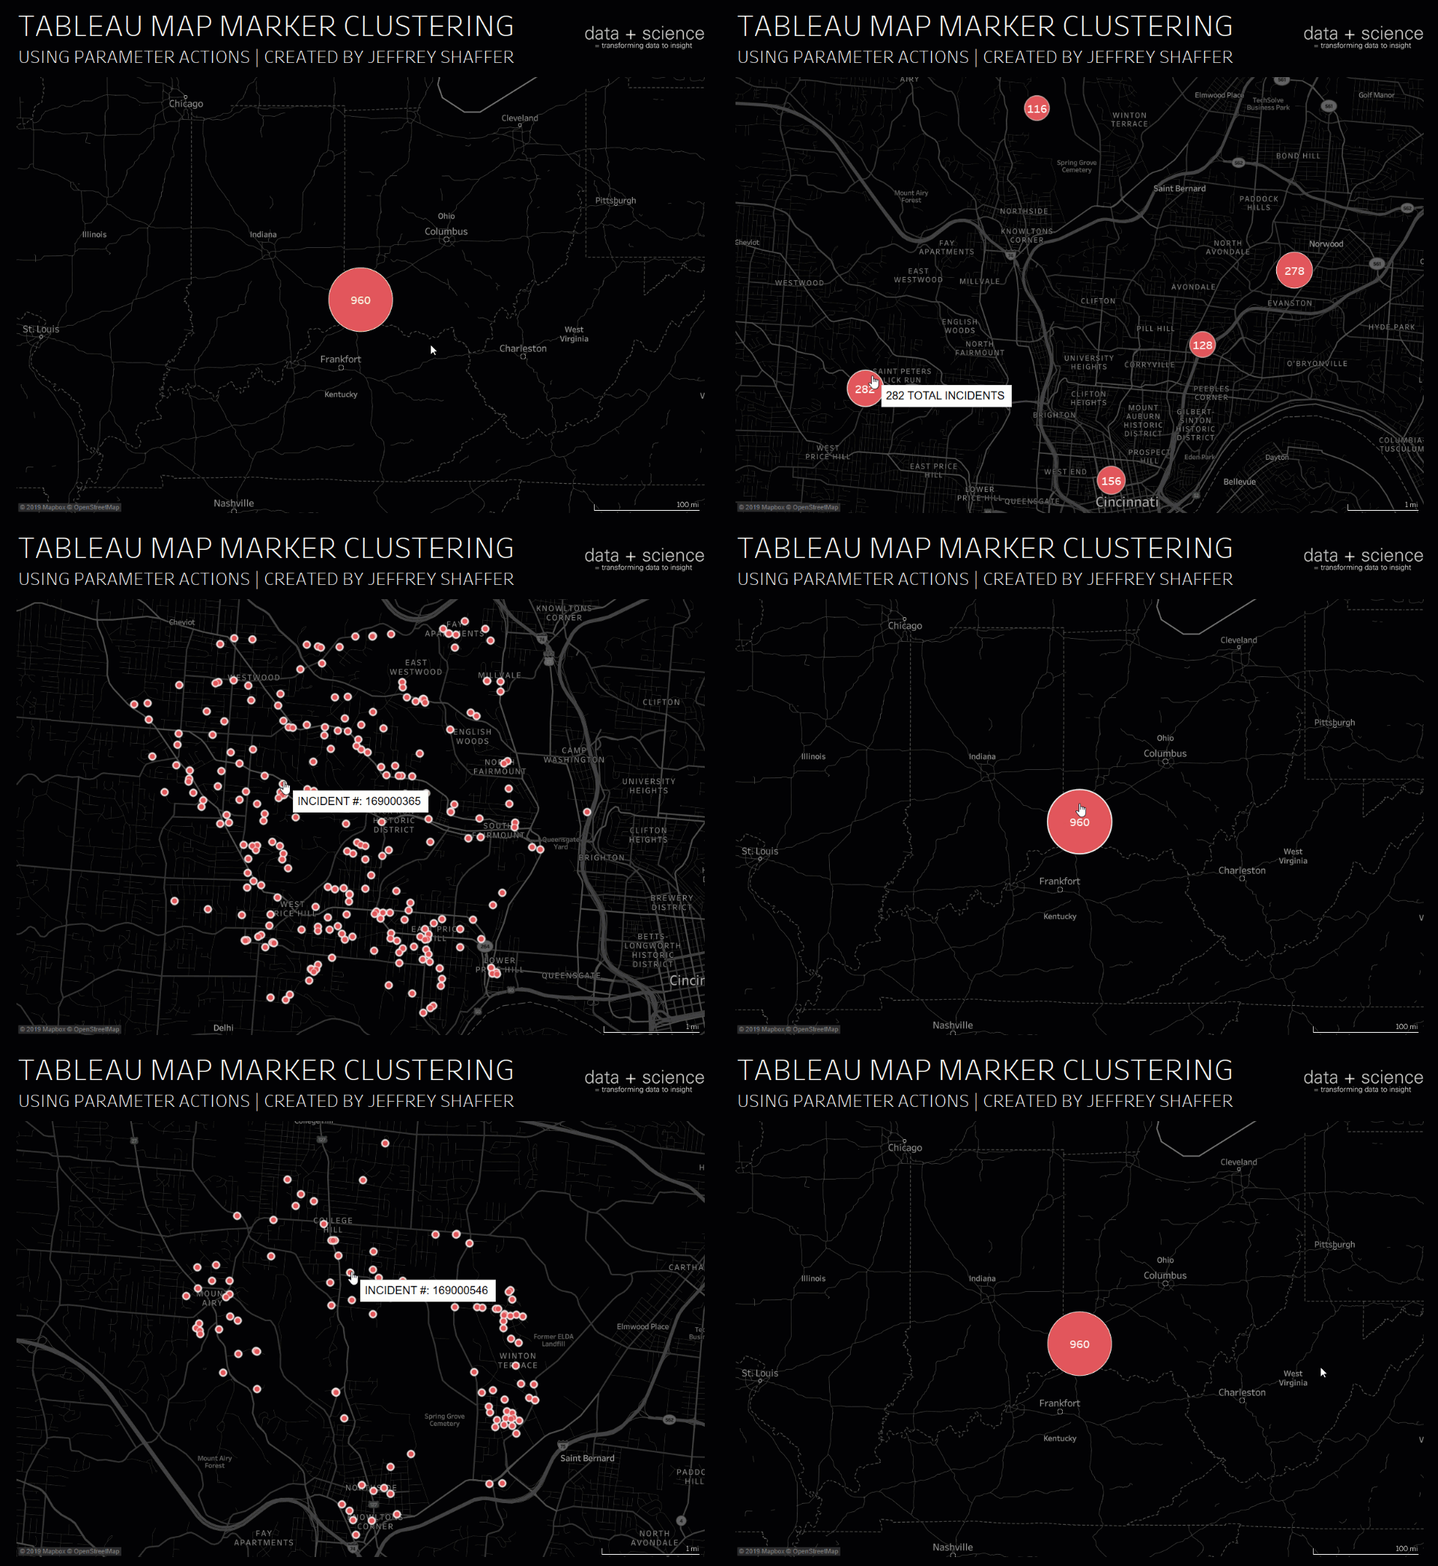
The visualization itself is done. If everything is working correctly, then you will see that the map change be a single marker when the parameter is set to 1. When you change the parameter to 2 it will show the custom groups that we created early and when set to 3 it will show all of the points. The labels and tooltip are dynamic, so they will also adjust based on the parameter value.
Adding Parameter and Filter Actions
The last step is to create a few Worksheet Actions (or Dashboard Actions is using a Dashboard).
Select Add Action
Select Change Parameter
Change Target Parameter to Zoom Rotate
Change Value Field to Rotation Index and Aggregation to Average and click OK
Clicking any marker on the map will now burst the marker into the next level. However, you will notice that at the third level, all of the marks are shown. If you would prefer the map to filter or zoom in on the points at the second and third levels, then we need to add another action to filter the points.
Select Add Action
Select Filter
Change Run Action to Select
Set the Clearing Selection to Show All Values
Click Selected Fields under the Target Filter
Click Add Fileter and select First Zoom from the list in both dropdown boxes.
The map will now drill-down when you click on the markers, changing the parameter value and changing the number of marks that are shown. In addition, the filter action will filter out marks that are not part of the selected marks. If you want your map to zoom in at each level then be sure to unpin your map so that it will adjust the zoom level automatically to the filtered mapped points in the window.

That's it. The rest is simply formatting the map and the marks as desired.
Below is a Tableau Public Visualization putting all of this together.

