6/15/2020
Bin There, Done That: A Discussion of Bins in Tableau
Creating bins in Tableau seems pretty straight forward, right-click on a Measure and select Create -> Bin and you're done. However, there are some restrictions and pitfalls that are very important to understand. In this post, I will explain these and offer a few solutions, including a hidden function in Tableau that I think you'll find very handy.
I'm going to be referencing Jonathan Drummey a number of times in this blog post, but what else is new. More often than not, things in Tableau connect their way back to Jonathan Drummey and Joe Mako. There are a few good posts on the subject of bins as well as a great Tableau workbook.
First, let's start with this blog post from Jonathan about bins.
One of the big restrictions with bins is that when you create a Histogram using the bins, you are not able to add a reference line. Jonathan and Joe offer their own equations that allow you to create your own bins, thus using a calculated field as a bin, and therefore you can add reference lines to the histogram.
These calculations are good solutions, and even though this blog post is from 2014, these solutions can still be used today.
Nick Hara wrote this excellent blog post called "I've Bin Everywhere" (January 2019), where he shows a number of examples and provides this great Tableau Workbook available for download.
Let's explore some things about bins.
Be Careful of Floating Points
One of the pitfalls in using the default bins in Tableau occurs when binning decimal values. This is because of floating point issues when dealing with the arithmitic of the Floor() or Ceiling() functions in Tableau. This issue is outlined in this knowlege base article by Tableau, Histograms Display Decimal Values in Incorrect Bins. In short, multiply the decimal values by 100 or 1,000 in a calculation to remove the decimal places, then bin that calculated field. Note, this is what Nick does to solve this issue in his workbook mentioned above.
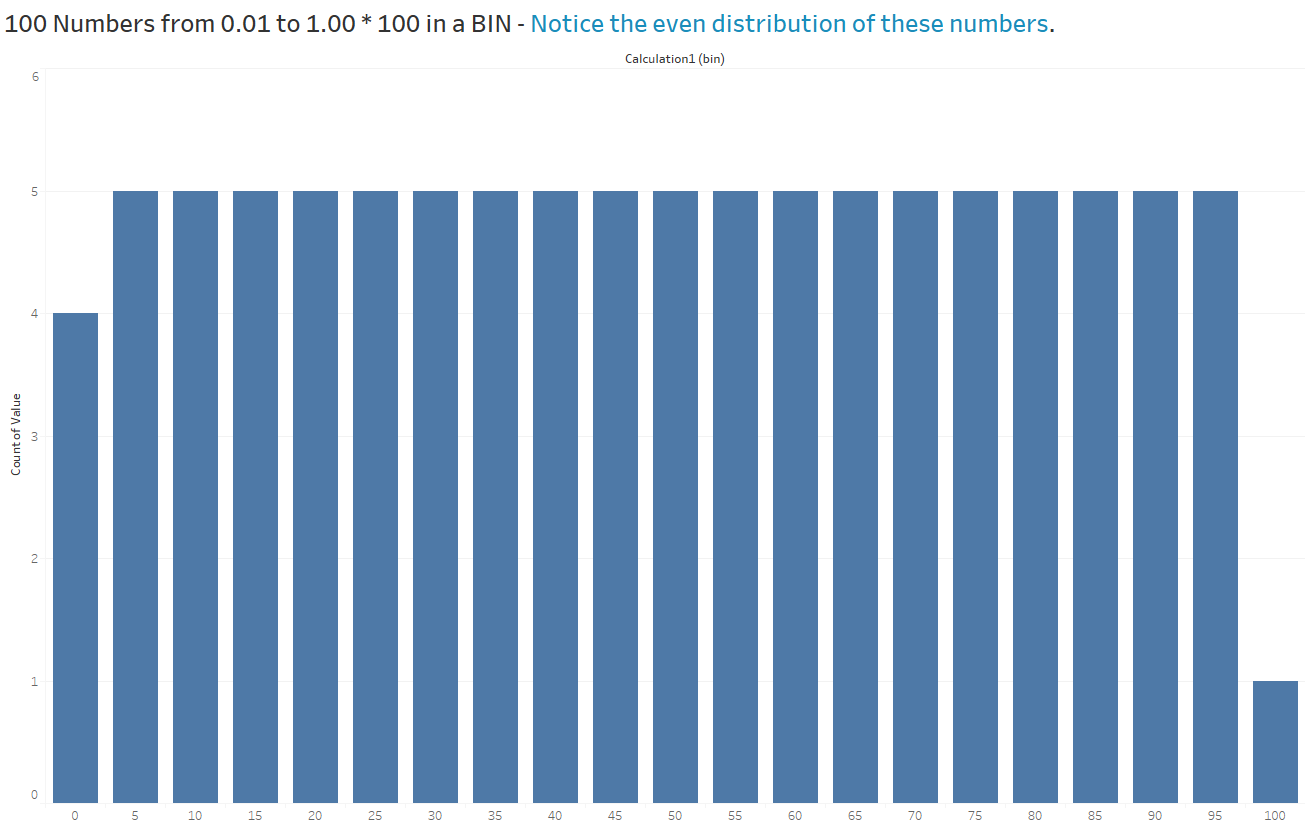
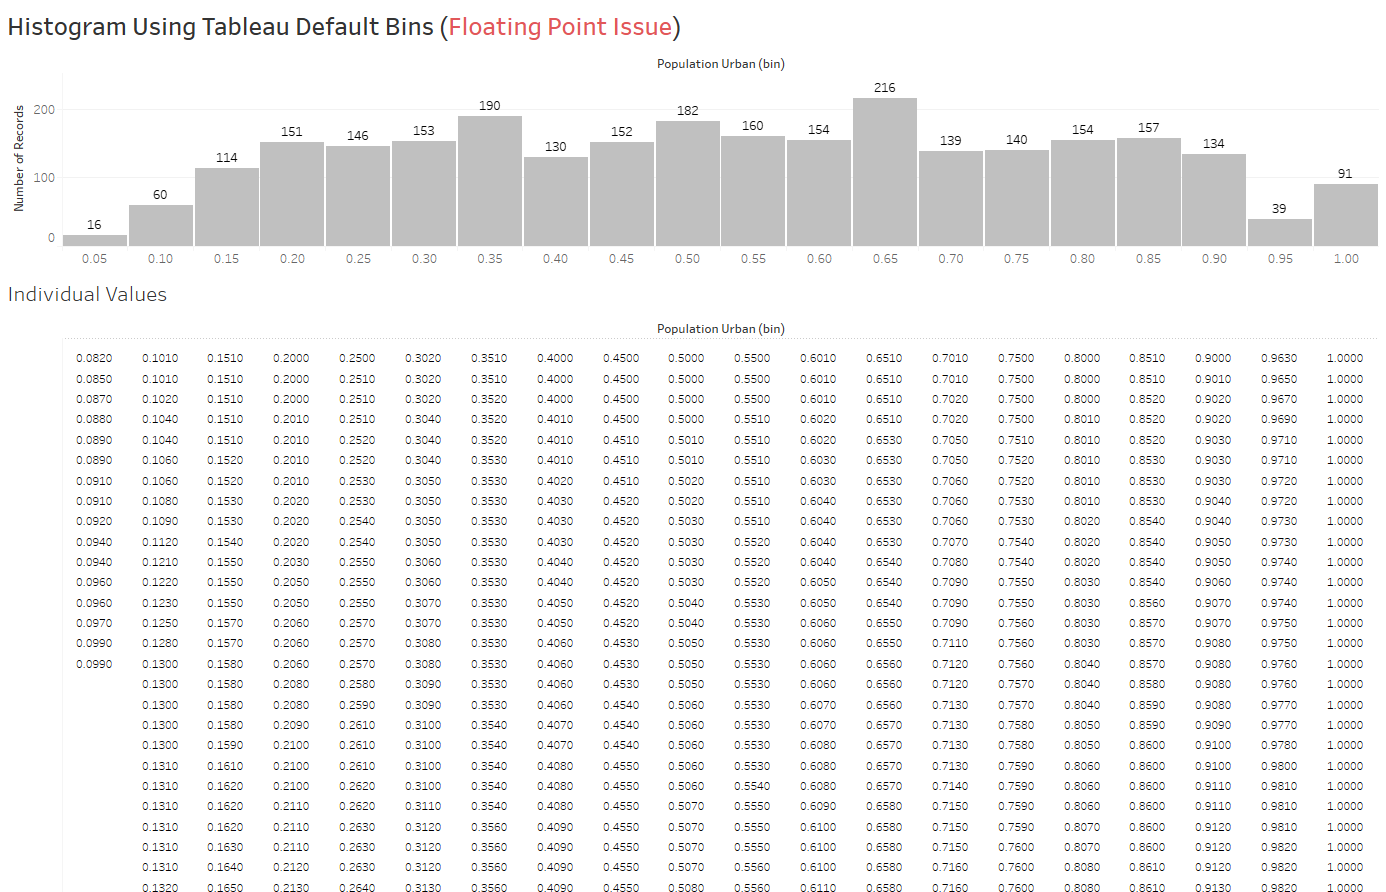
As an example, here's what the bins look like in Tableau when I take 100 numbers from 0.01 to 1.00, in increments of 0.01 and bin them with the bin size of 0.05. We'd expect these to be fairly even bins, but they are not.

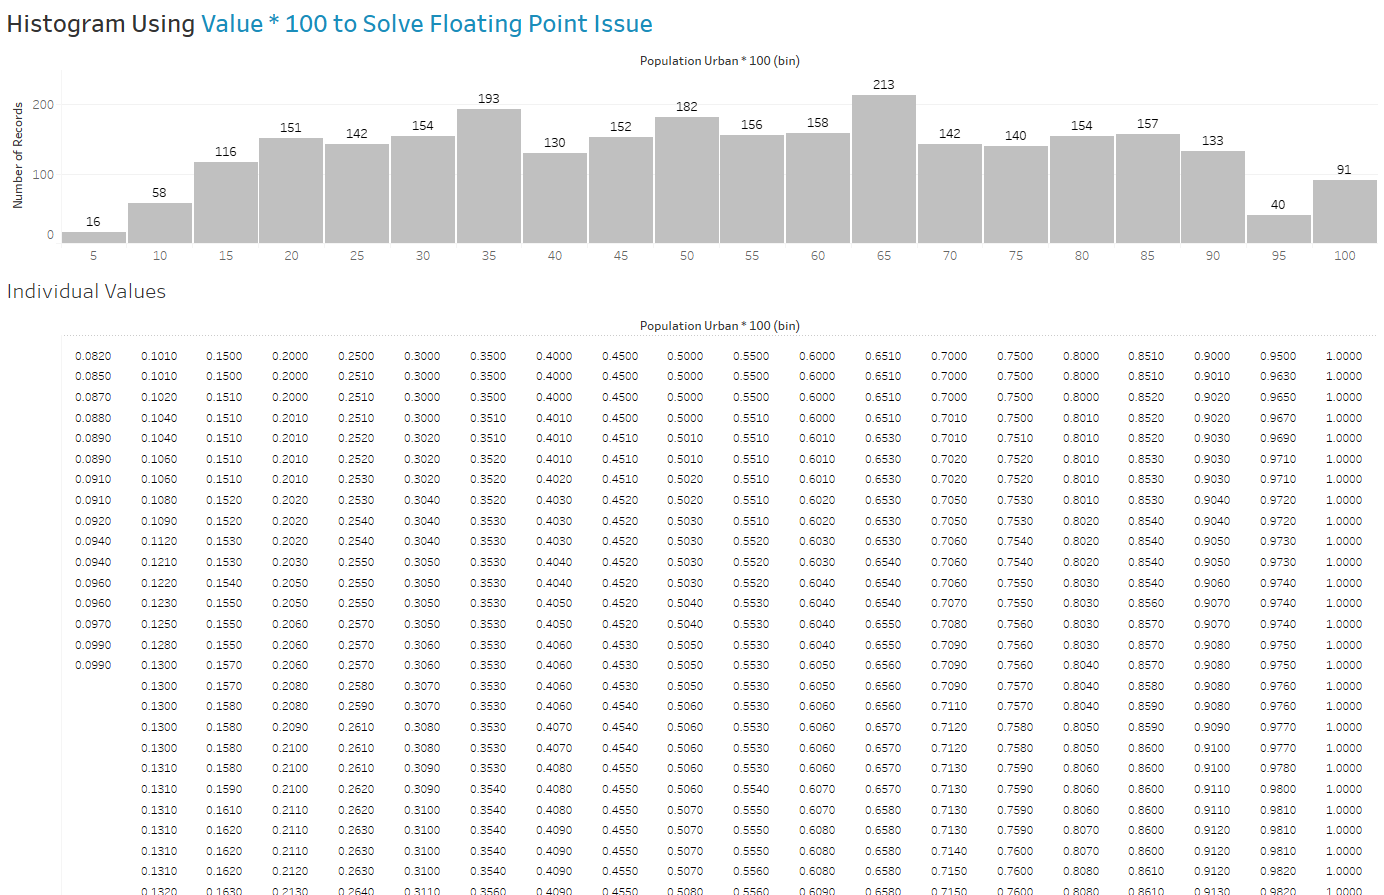
Now I will take that same field and multiply it by 100 and create a bin using that calculated field with bin size 5. When we do this we get the bin distribution that we would expect to see.
Ok, so that's pretty straight forward, but there are other issues that we can encounter. Let's look at how these custom calculated fields for bins distribute the values in these bins.
Be Careful of Bin Distribution when Using Custom Calculations
Nick originally created his binning solution for something at work. For his blog post, he ported that solution over using the World Indicators data from Tableau Desktop, specifically the field Population Urban, which is a decimal number representing the percent of the population that is urban in each country over several years. This turns out to be a great use case for this discussion, because we encounter both issues, the floating point issue and issues with how the bins are distributed with these custom calculations.
Let's step through this and work our way to a final solution. While this section may look long, very detailed and complicated, I promise that the final solution is pretty easy and straight forward (and we'll learn a hidden function in Tableau too).
I modified Nick's workbook to show the values that comprise his histogram. Below is the histogram and the individual values in a stem and leaf plot (cut off at ~30 rows).
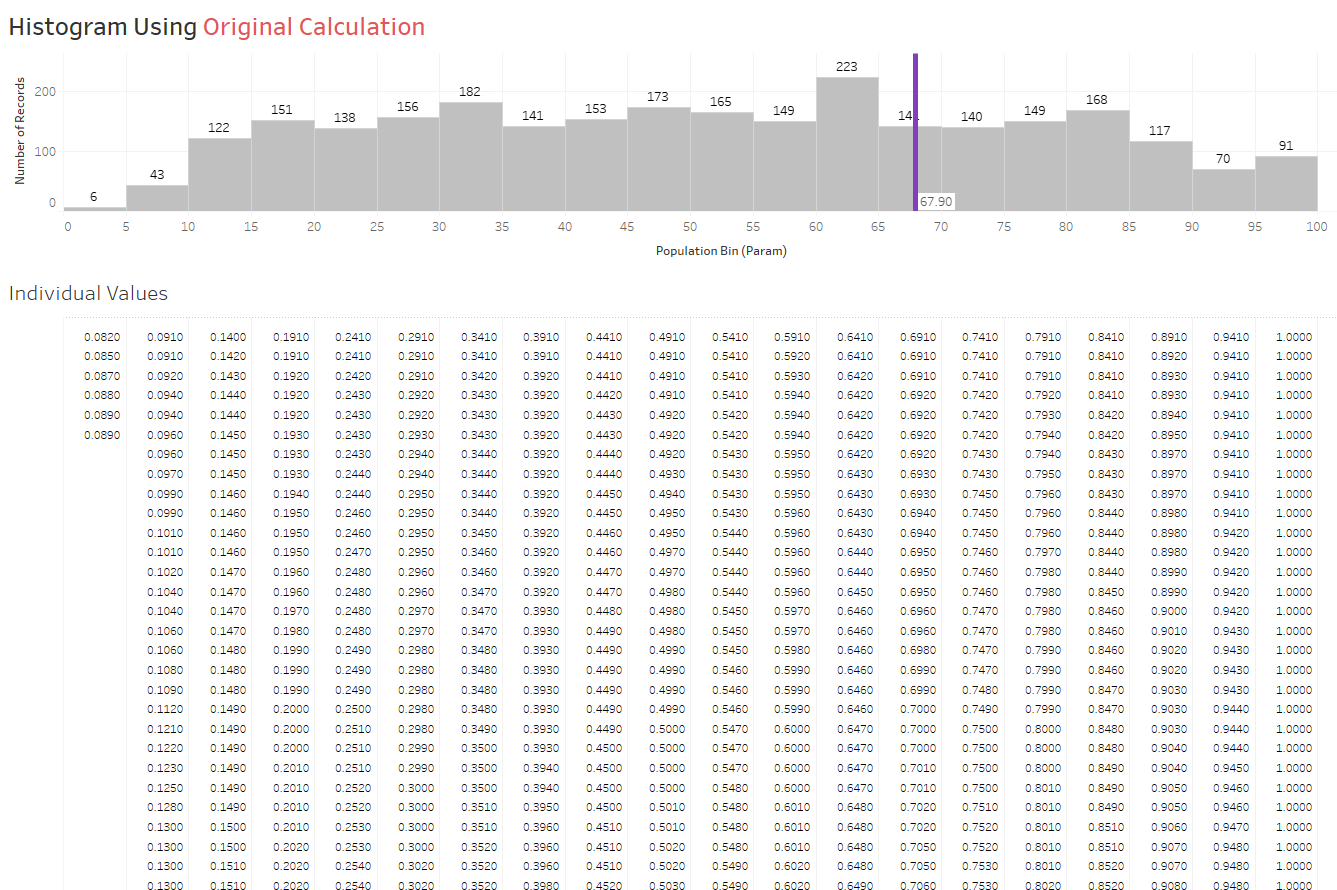
You may notice some issues with the binning right away. First, the bin starts at 0 to 5 and the values that within that first bin are actually between 5 and 10. Second, and more concerning, there are values in the second bin that should be grouped with the first bin. For example, the value 0.0910 should be grouped with the other values that are between 5 and 10.
Nick's formula for his calculated field:
Calculated Field: Population Bin (Param)
Formula:
([Urban Bin]-( CEILING([Population Urban]*100)%[Urban Bin])) + CEILING([Population Urban]*100 ) - [Urban Bin]
Note - [Urban Bin] is a parameter that Nick created to change the bin size
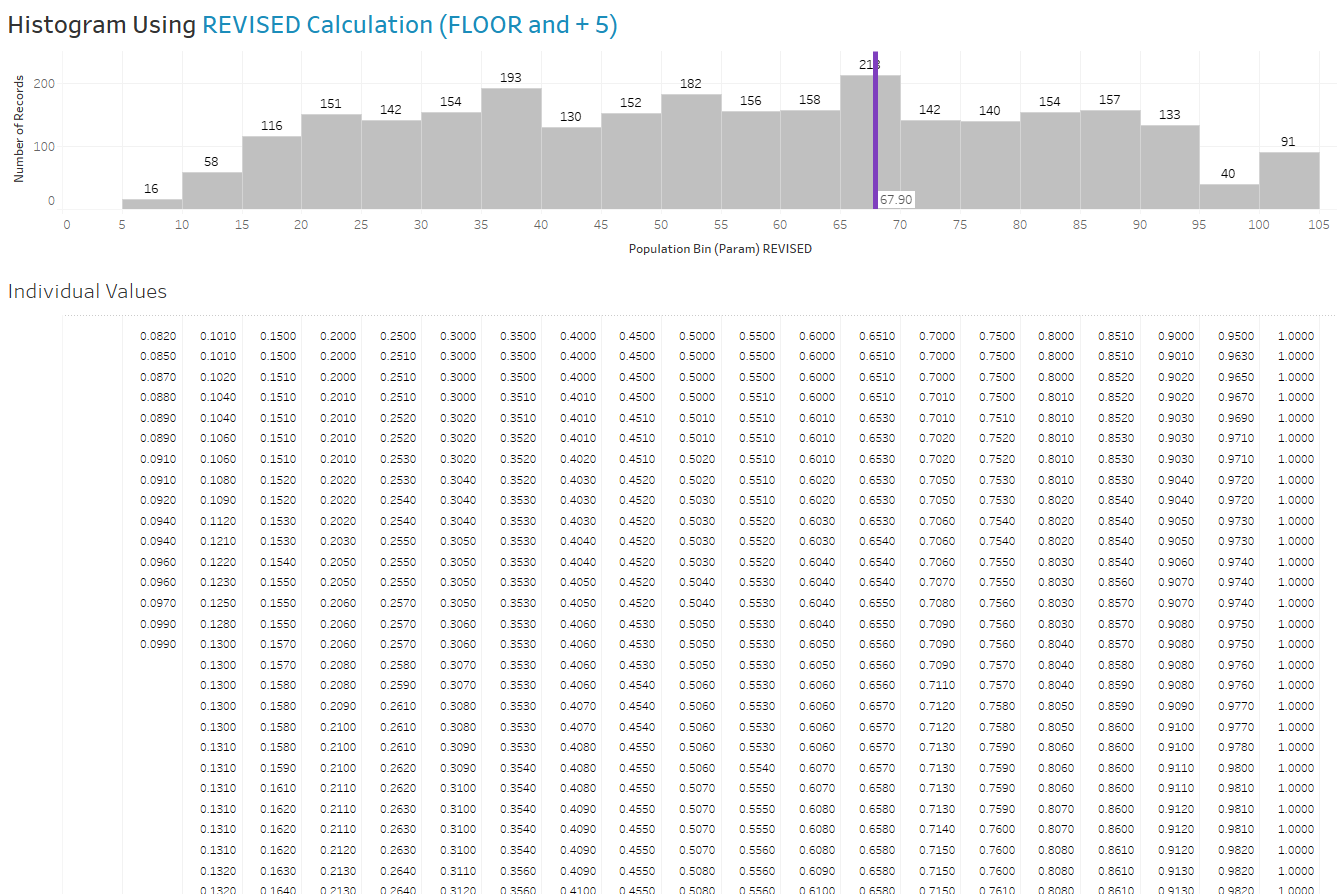
Let's make two minor changes to Nick's formula. First, we will change the CEILING function to a FLOOR. Second, we will add 5 to the value of the bins to slide them over one bin value, which in this case simply means we remove the -[Urban Bin] from the equation.
Calculated Field: Population Bin (Param) REVISED
Formula:
([Urban Bin]-(FLOOR([Population Urban]*100)%[Urban Bin])) + FLOOR([Population Urban]*100)
Our revised formula creates these bins. This is actually correct and works as a final solution.
However, if we check these bins against the default Tableau bins it won't match. That's because th Tableau default bins are encountering the floating point issue described earlier.
If we create a caluclated field and multiply it by 100 and create a bin using that new calculated field then it solves this issue and the bins match the REVISED calculation above.
The default bins work great, but unfortunately we can't add a reference line to the default bins because they are Discrete. We've now come full circle. We've corrected the calculation formula to create a continuous bin and we've corrected the default bins. Both are correct now, but the continuous bins created by the calculated field is the only one that allows the reference line we are looking for.
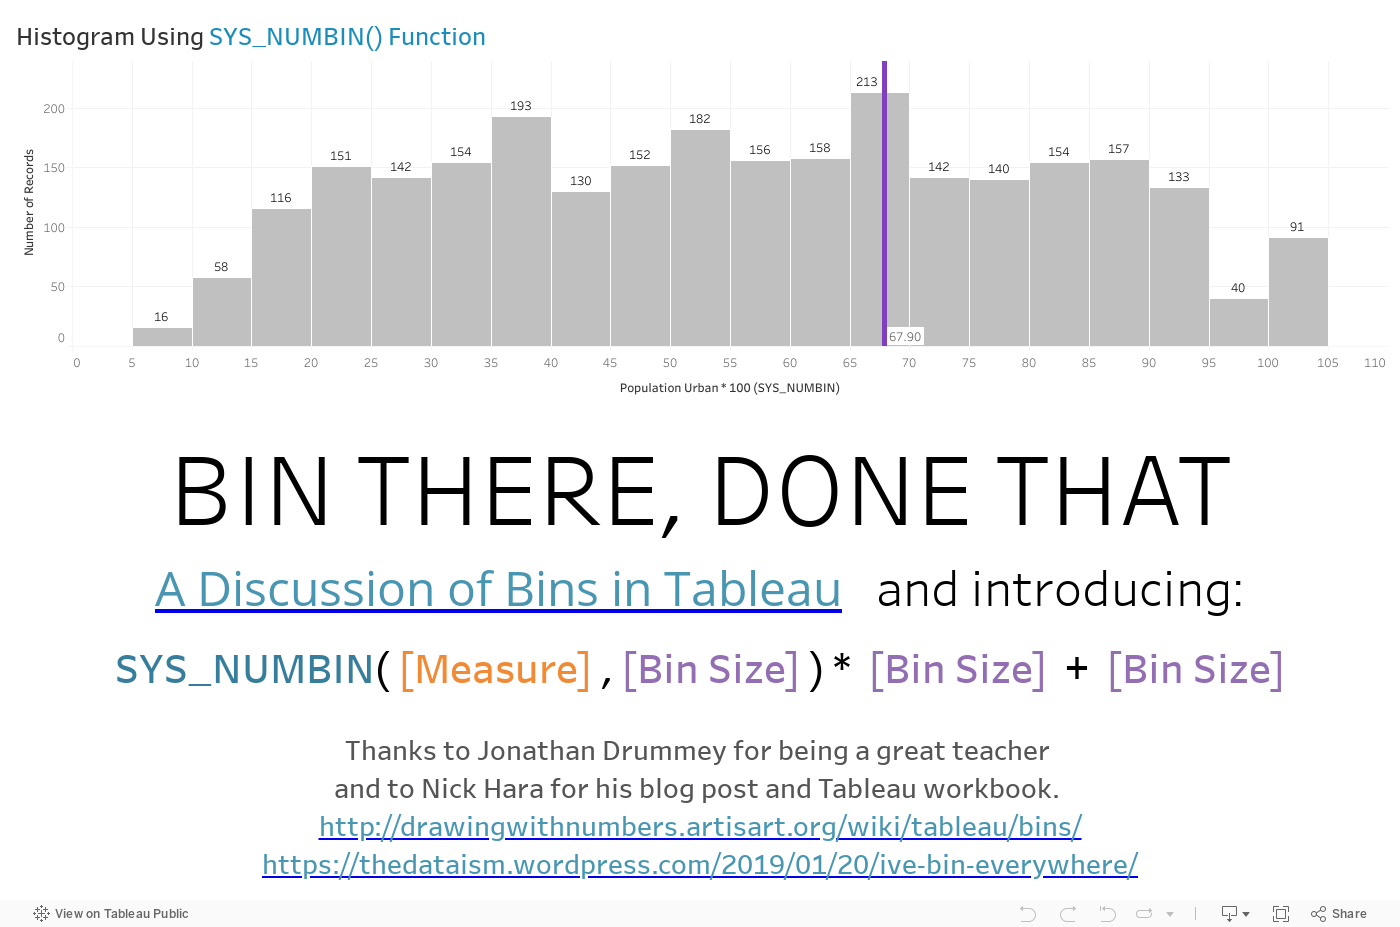
Using a Hidden Function in Tableau: SYS_NUMBIN()
I can't take any credit for finding this hidden function. Back in June 2017, Jonathan Drummey came out to our office for some hands on Tableau training with our small team of Tableau developers and data scientists. In one of our many conversations over those two days, Jonathan mentioned running across this function. As I recall, he was working in Tableau, he encountered some sort of issue and a strange error box popped up on him. He saw this function and decided to give it a try, and sure enough it worked in the calculation window. We talked briefly about how we might use this, but we moved one, time passed and every so often I revisit it. Well, as it turns out it's a great solution for this particular problem and is super simple to use.
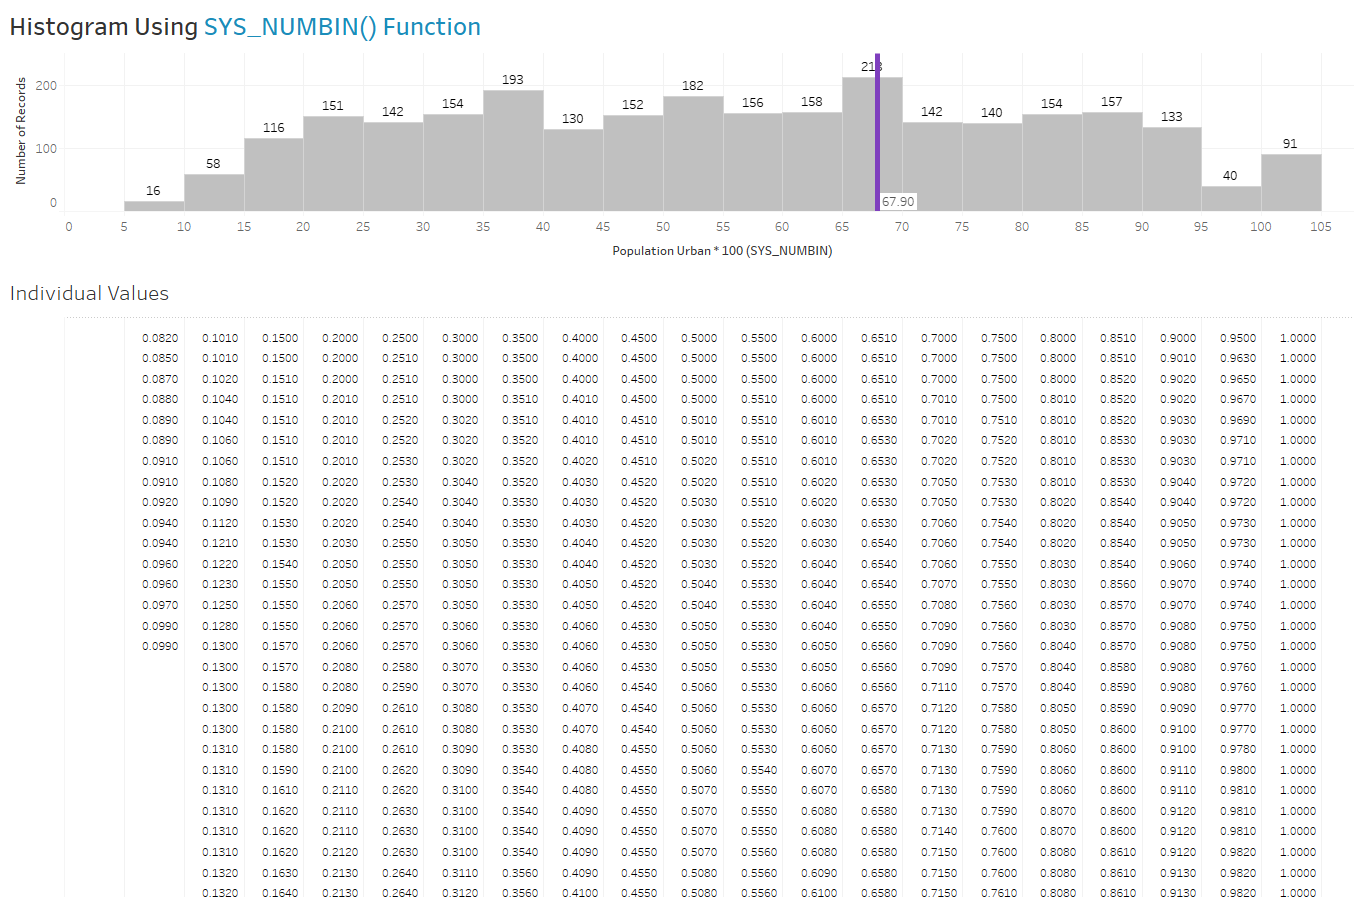
The syntax is SYS_NUMBIN([Measure], [Bin Size]). In this case, it would be SYS_NUMBIN([Urban Population], 0.05), but as we've learned that will be problematic. Also, this function will create integer bins starting at 0, then 1, etc. So we'll make a few minor adjustments. To solve the floating point issue we'll use the field that multiplies the Measure by 100.
To change the bins from [0,1,2...] to [5,10,15] we will multiple the bins by the bin size and then add the bin size. For example, (0*5) + 5 = 5 for the first bin. (1*5) + 5 = 10 for the second bin, and so on. To match the bins that Tableau would create automatically it would look like this: (SYS_NUMBIN([Measure], [Bin Size]) * [Bin Size]) + [Bin Size]. In this case, the new formula would be.
Calculated Field: Population Urban * 100 (SYS_NUMBIN)
Formula:
(SYS_NUMBIN([Population Urban * 100],[Urban Bin]) * [Urban Bin]) + [Urban Bin]
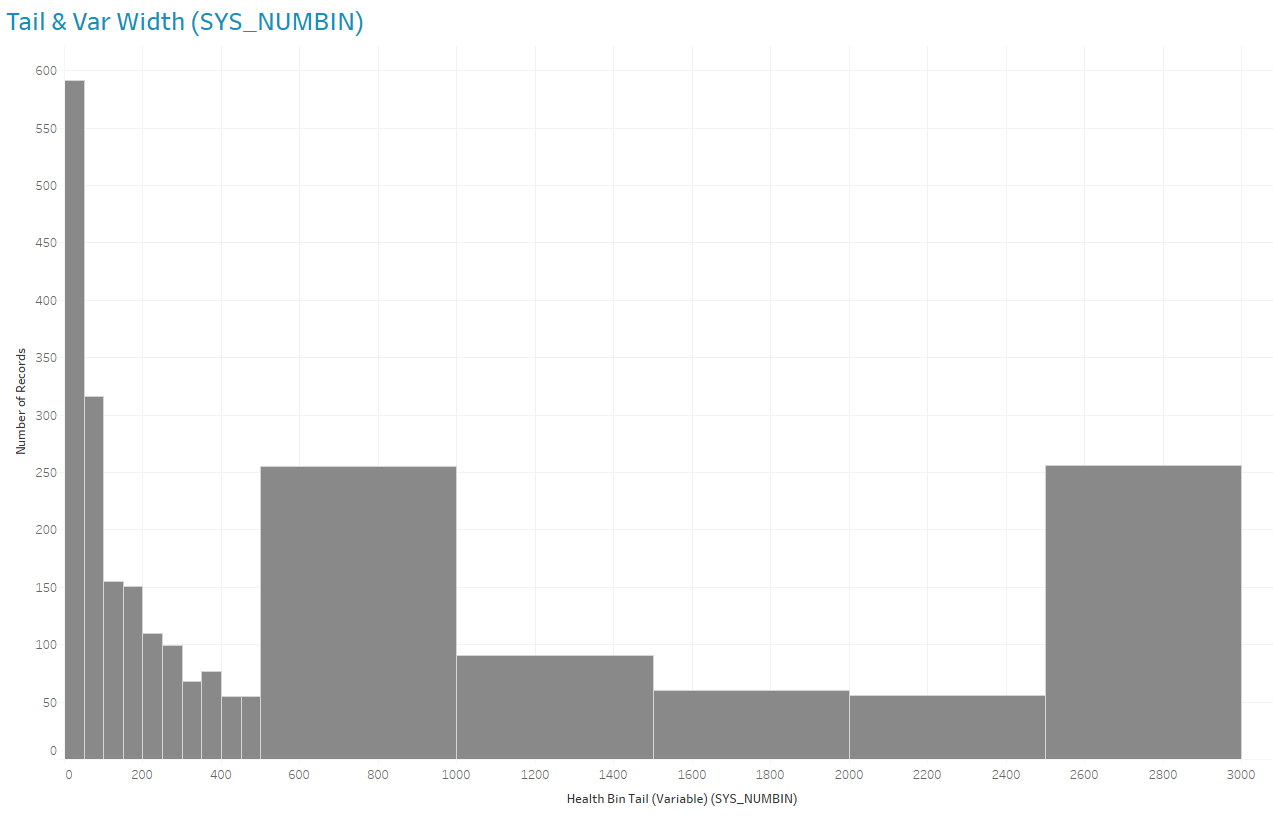
In addition, we can use the SYS_NUMBIN() function to simply some of the equations that Nick created. For example, he had a great example of distribution with a tail and variable width. His formula looks like this:
Calculated Field: Health Bin Tail (Variable)
Formula:
IF [Health Exp/Capita]>=[Health Threshold] THEN [Health Threshold]
ELSE
IF [Health Bin]>=[Health Exp/Capita] THEN
(([Health Bin]*.1)-(CEILING([Health Exp/Capita])%([Health Bin]*.1)))
+ CEILING([Health Exp/Capita])-[Health Bin]*.1
ELSE ([Health Bin]-(CEILING([Health Exp/Capita])%[Health Bin]))
+ CEILING([Health Exp/Capita])-[Health Bin]
END
END
Using the SYS_NUMBIN() function we can simply this to:
Calculated Field: Health Bin Tail (Variable) (SYS_NUMBIN)
Formula:
IF [Health Exp/Capita]>=[Health Threshold] THEN [Health Threshold]
ELSE
IF [Health Bin]>=[Health Exp/Capita]
THEN (SYS_NUMBIN([Health Exp/Capita],[Health Bin]*.1) * [Health Bin]*.1)
ELSE (SYS_NUMBIN([Health Exp/Capita],[Health Bin]) * [Health Bin])
END
END
This produces the exact same distribution:
Other Notes of SYS_NUMBIN()
Here are just a few other things we can do with continuous bins in Tableau.
Having a continuous bin was the goal in this particular case, because we wanted to add a reference line, but you could also add a reference band, distribution band or box plot to you binned histogram.
Because it's a custom calculation, you can use the bin in a calculated field. For example, you could combine with parameter actions, set actions or other calculations to assign color to the bins.
Easily set the width of the bins using other rules. This isn't anything new. People have been doing this for years, but it's just a little easier now. For example, the Freedman-Diaconis rule for determining bin width for a continuous variable is [2 * (IQR/n^(1/3))] where IQR is the interquartile range and n is the number of records. We can easily create a calculated field using the Freedman-Diaconis rule and then we can just drop that in the SYS_NUMBIN() function for the bin size.
Calculated Field: Freedman-Diaconis Bin Size
Formula:
{ 2 * ( (PERCENTILE([Population Urban * 100], 0.75) - PERCENTILE([Population Urban * 100], 0.25)) / POWER(count([Number of Records]), 1/3) ) }
Calculated Field: Population Urban * 100 (SYS_NUMBIN with FD)
Formula:
(SYS_NUMBIN([Population Urban * 100],[Freedman-Diaconis Bin Size]) * [Freedman-Diaconis Bin Size]) + [Freedman-Diaconis Bin Size]
There are number of formulas that could be used to determine the width of the bins (see more examples here). Note - The formula that Tableau uses by default to determine the number of bins is Number of Bins = 3 + log2(n) * log(n) where n is the number of distinct rows in the table. The size of each bin is determined by dividing the difference between the smallest and the largest values by the number of bins.
Note - It seems that SYS_NUMBIN(), even when used as a discrete dimension, does not turn on data densification like a typical bin would. This makes sense, because we've converted the pill type from a bin to a discrete dimension and the later doesn't turn on data densification (read more about Data Densification Using Domain Completion and Domain Padding here).
None of these things use cases are new, since we could use other equations (from Jonathan Drummey, Joe Mako, Nick Hara and others) to create continuous bins. However, I find the SYS_NUMBIN() function is much easier to remember, so I hope you find this hidden function and this information useful when creating bins in Tableau. Below is a Tableau Public Visualization with all of these examples that you can download and explore.