12/31/2016
2016 - A Year in Review
It's been a fantastic and very busy year. A big thanks to all the readers of this blog. It's hard to believe that the year is over, but looking back is always fun. Here are a few of the highlights of 2016.
Dear Data Two
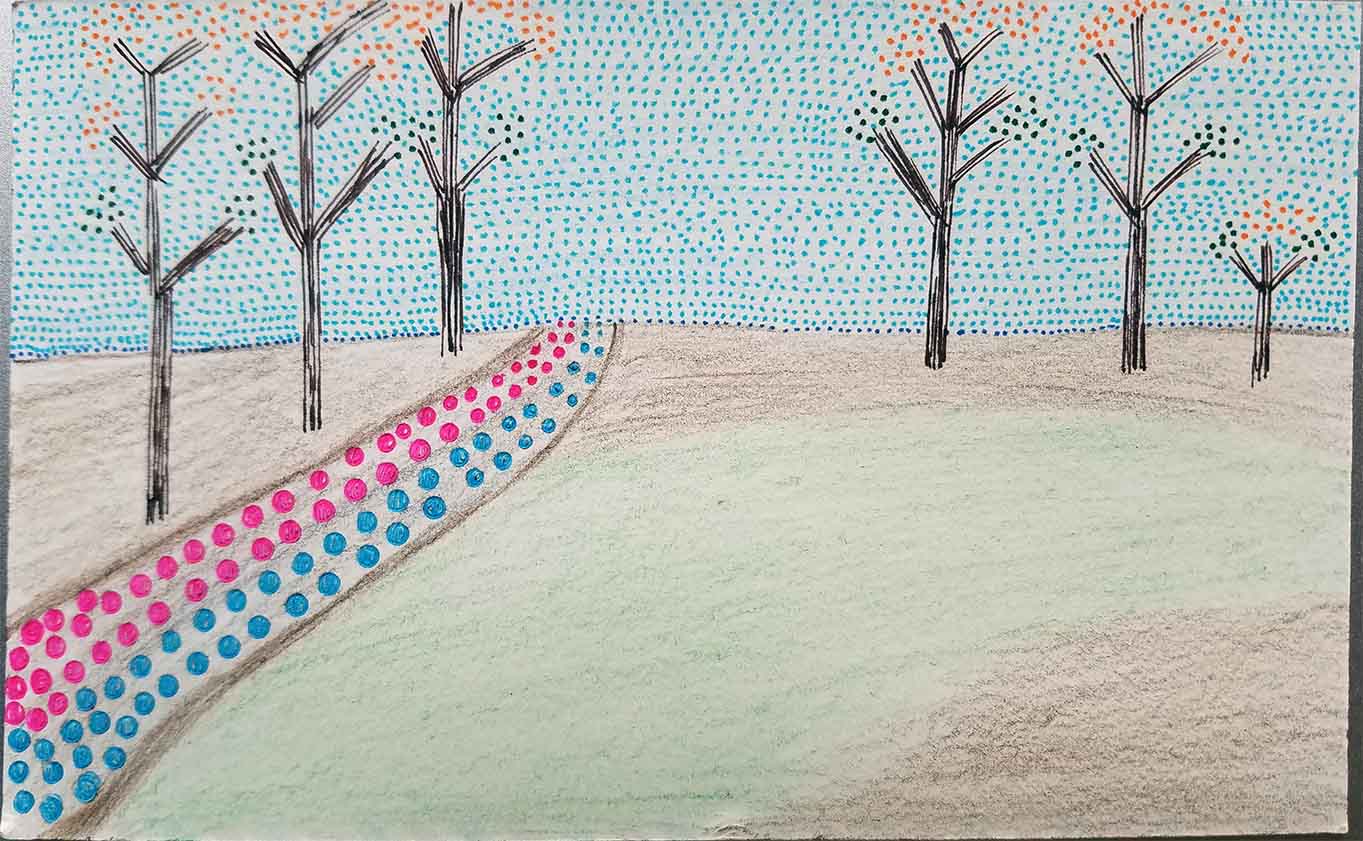
Dear Data Two came to an end in 2016. This was a year-long project with
Andy Kriebel and it was a bittersweet goodbye. Andy and I sent postcards back and forth for 52 weeks, with the project ending in April. It was a long road, but we both learned so much through the project. We learned about ourselves and each other and we both honed our skill in sketching data and Tableau. For those who followed along with us, thank you. I hope you enjoyed the project as much as we have. Also, be sure to follow
Lorena Strecker who is working her way through the 52 weeks by herself and is creating some beautiful work.

Graphic Design Lessons
This is something I've wanted to do for a long time. I did not study graphic design in school, so what I've learned over the years has only been through reading books and online resources. I had the opportunity this year to study a bit one-on-one with Darrin Scott Hunter of
Dish Design. Darrin was a former professor of graphic design at the world-renown University of Cincinnati College of Design, Architecture, Art, and Planning. He has been very generous of his time this year to help me learn more about design, layout, color and font, all from a graphic design professor's perspective. I even created my first font specimen and a classic grid design exercise. I hope to study this more in 2017.
A few of my early examples:


The Big Book of Dashboards
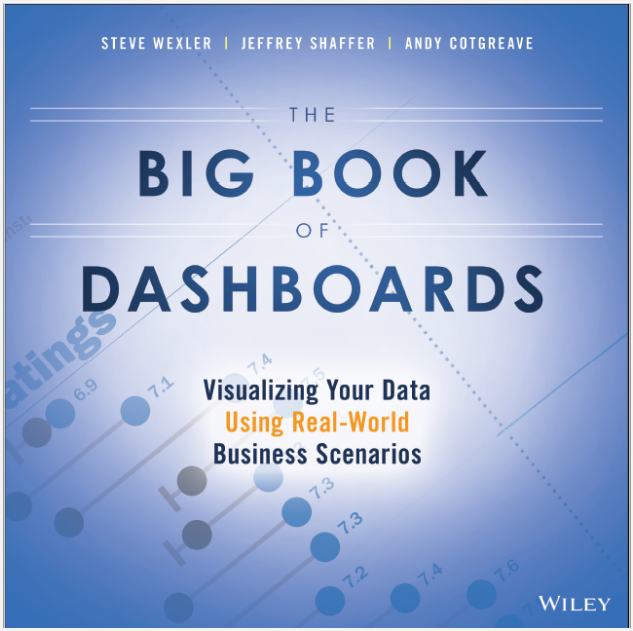
There was a huge amount of time devoted to the
The Big Book of Dashboards, which has been written, edited and sent to the publisher. Clocking in at over 450 pages, my coauthors (
Steve Wexler and
Andy Cotgreave) and I compiled 28 dashboards covering real-world business solutions (two of them shown below). The book is scheduled to be released in April. If you haven't already, please sign up for notifications regarding our upcoming book release
here.
It's been a great pleasure working with Andy and Steve. It was really fun having regular conversations about so many of these dashboards, the design decisions involved, data visualization best practices and their applications in the real-world. I will really miss this.

Data Plus Science
My
Data Plus Science blog was on the shortlist for data visualization websites for the Kantar Information is Beautiful Awards. This was a great honor for me, being included among some of the best data visualization websites out there. Posting 32 new blog posts this year, I received more than 250,000 pageviews in 2016 from over 115,000 users, with
the Tableau Reference Guide, now with over 400 curated links, and
the Tableau Conversion Tool being among the top visited pages for 2016. In addition, I started Tableau Tips and published 80 tips this year. I also had the opportunity to present at the Tableau conference with
Andy Kriebel again. Last year we presented together on the Dear Data Two project. If you missed our session this year then be sure to catch
50 Tips in 50 Minutes: Tableau Speed Tipping, which ended up to be a total of 86 tips in about 45 minutes!

University of Cincinnati
In April, I was awarded the Outstanding Adjunct Faculty of the Year in Operations, Business Analytics and Information Systems at the University of Cincinnati. We have such an amazing faculty at UC, so it was truly an honor to be recognized for the data visualization class that I teach. I've had the privilege of teaching 388 students in 6 classes this year as well as 6 workshops at the University of Cincinnati Center for Business Analytics. We have over 200 students in our two-day Tableau training workshops. Many of the UC students are now working in the field of data visualization, so I am very excited to see these students progress in their careers and see their future work.

Tableau Community
It was an honor to be selected again as one of
the 2016-2017 Tableau Zen Masters. This group of people, both past and present Zen Masters, have become good friends and are such an amazing resource for the Tableau community. There continues to be much to learn from these folks and others in the community that are doing such great work. I love to see new ideas spark and then watch the community build upon those ideas, one after the other. Thank you all for your amazing contributions and for your friendship. There are too many of you to list, but you know who you are!
Meanwhile the Cincinnati Tableau User group continues to grow. The highlight of the year was having the Tableau co-founders present at one of our meetings. We have some exciting things planned for 2017, so there is definitely more to come from the Cincy TUG.

Happy New Year everyone and I wish you all a great 2017!
Jeffrey A. Shaffer
Follow on Twitter
@HighVizAbility


